


在后台数据统计,同时利用ECharts生成统计图,以及dataTables统计数据列表。有时便会需要进行图表之间的交互,从而带给用户更加直观的数据体验。如下图需求:
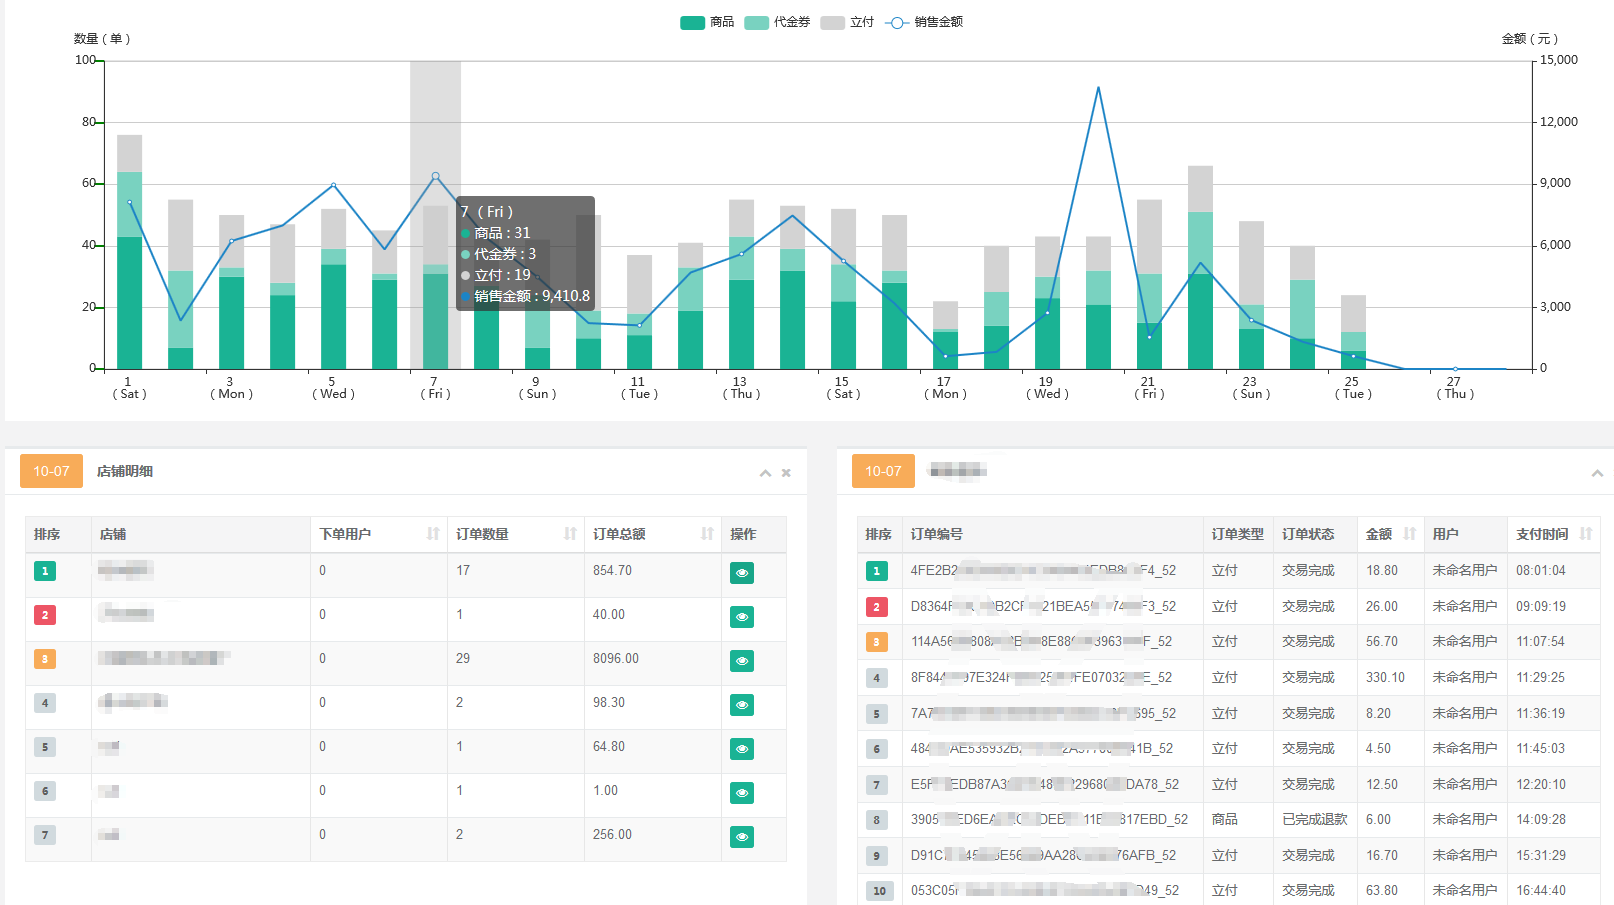
先由ECharts生成本月每天销售数据统计图,然后达到单击统计图每日柱形时,呼出左下角当天各店铺销售统计的dataTables表。
点击另外一天直接切换到另一天的数据表。但是,由于dataTables在同一dom创建dataTables实例时,必须销毁之前已经建立的dataTables。因此,需要利用js的全局变量记忆每次生成的dataTables实例。
模板代码:
<div>
     <div id="lineChart" style="height:390px"></div>
</div>

<table class="stores-table" width="100%">
      <thead>
            <tr>
                <th>排序</th>
                <th>店铺</th>
                <th>下单用户</th>
                <th>订单数量</th>
                <th>订单总额</th>
                <th>操作</th>
            </tr>
        </thead>
        <tbody class="stores-list">
            ......
        </tbody>
</table>
将绘图表独立封装到方法之中:
//创建统计图
function createChart(data){
var chart = echarts.init(document.getElementById('lineChart'));
    。。。。。。      //具体配置参见本人之前博文(下方有链接)
return chart;
}
//创建店铺列表
function createStoresTable(date){ //定义全局变量 window.变量名
if (typeof(window.dt1) != "undefined") {
window.dt1.destroy(); //如果存在dataTables实例,销毁
}
var datat = $(".stores-table").DataTable({
//具体配置见之前博文,下有链接
});
window.dt1 = datat; //用全局变量记录dataTables
}交互:
var chart = createChart(res.data);
chart.on('click',function(params){
     var today = $.trim(params.name.substr(0,2));     //params.name即为横坐标值
     var newdate = date +"-"+ today;
     createStoresTable(newdate);
 });


 1149
1149


 被折叠的 条评论
为什么被折叠?
被折叠的 条评论
为什么被折叠?
 到【灌水乐园】发言


