


最近,因为不确定蓝牙、网络和launcher的启动时间早晚问题,一直有各种问题,就想用bootchart来看下开机启动后的所有服务的启动时间。
一 Android版本编译好bootchart
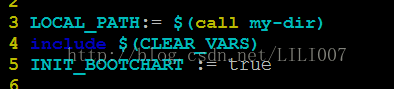
1.在system/core/init中的Android.mk中加入bootchart的宏。
INIT_BOOTCHART := true
2.进行mm -B 强制编译一下,编译完成后会生成init到out目录下面。

3.因为生成的init在root目录下面,所有需要重新做boot.img然后进行烧录,各个芯片厂商不一样,这一步的目的就是把第二部生成的init烧录到盒子中。
二 生成开机启动log文件
1.在data目录下面,创建bootchart-start文件,然后echo 一个数字进去,这个数字是开机启动一直进行bootchart的时间。
进入shell 输入下面的命令,这样会抓起开机90S内的启动log。
touch bootchart-start
echo 90 > bootchart-start
2.重启盒子,盒子起来后会在data目录下面自动创建bootchart的文件夹,里面会有相关的log
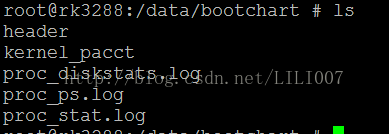
3.执行 buybox tar -czf bootchart.tar header *.log kernel_pacct 把生产的文件打个包,然后push出来,用该tar来进行png图片的制作。
三 制作png图片
1.在ubuntu系统安装bootchart工具,sudo apt-get install bootchart
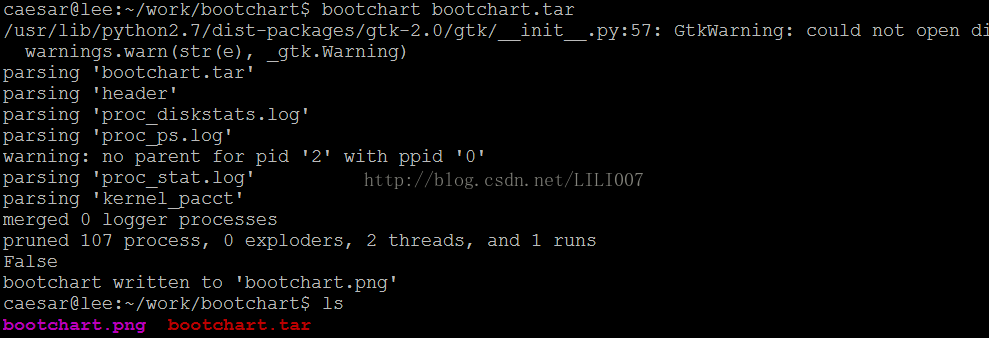
2.执行 bootchart bootchart.tar 会在当前目录下生产bootchart.png
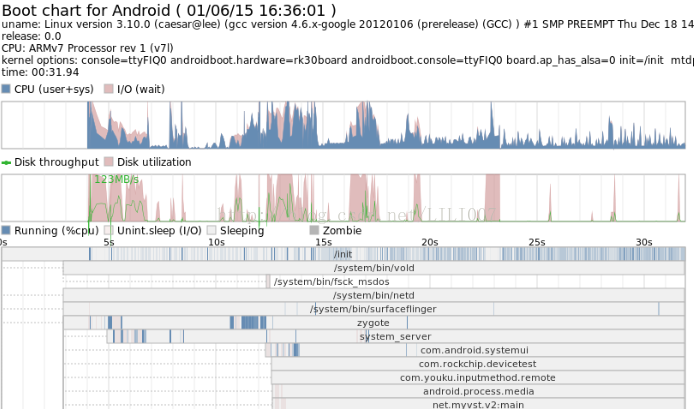
3.把bootchart.png拷贝到windows下面,打开可以看到如下图片,
会把每个进程的启动时间,cpu占用情况很明显的表现出来,前面是启动时间,蓝色的是cpu占用时间。注意改时间并没有把uboot的时间算进来,是从kernel里面的init进程开始算的。
ps,开始执行bootchart bootchart.tar的时候会报错,修改下下/usr/share/pyshared/pybootchartgui/下面的脚本执行成功。修改之前最好先备份下,可能没个系统的遇到的情况不一样。
我的系统是14.04,修改如下:
draw.py: 将200, 201行由: xscale = float(chart_bounds[2]) / max(x for (x,y) in data) yscale = float(chart_bounds[3]) / max(y for (x,y) in data) 改为: xscale = float(chart_bounds[2]) / max(0.00001, max(x for (x,y) in data)) yscale = float(chart_bounds[3]) / max(0.00001, max(y for (x,y) in data)) parsing.py: 在156行后添加: if interval == 0: interval = 1 修改后如下: sums = [ a - b for a, b in zip(sample1.diskdata, sample2.diskdata) ] if interval == 0: interval = 1 samples.py: 在81行后添加: if interval == 0: interval = 1 修改后如下: def calc_load(self, userCpu, sysCpu, interval): if interval == 0: interval = 1


 1352
1352


 被折叠的 条评论
为什么被折叠?
被折叠的 条评论
为什么被折叠?
 到【灌水乐园】发言


