


a、怎样在coding过程中避免内存泄露?
b、怎样检测内存泄露?
怎样避免就不赘述了,网上很多答案。
工具呢,当然也有很多,比如DDMS、MAT等,但是怎样在我们编码过程中植入内存检测代码,让我们程序在开发调试阶段就能发现内存泄露呢?好了,现在该大名鼎鼎的LeakCanary出场了,它是Square公司的一个内存探测开源项目。下面就介绍下怎样使用.
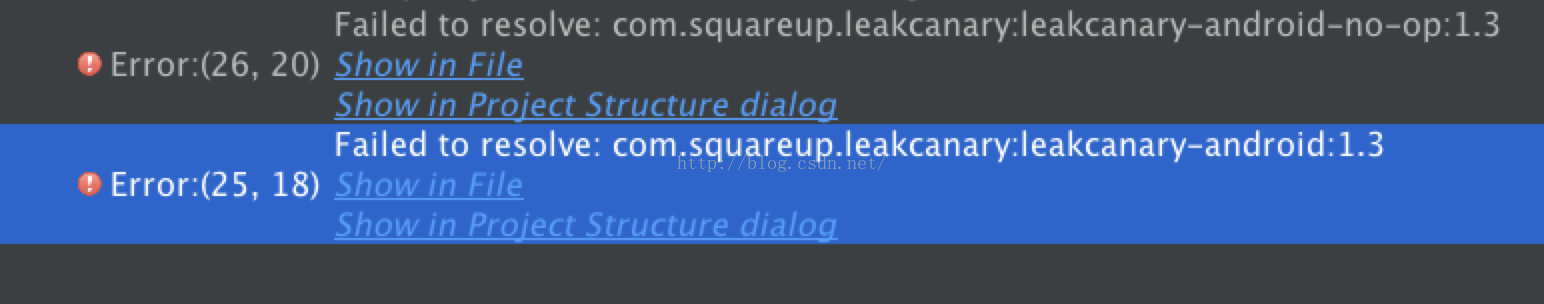
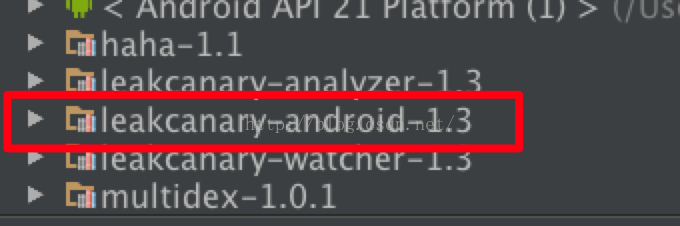
1、配置gradle依赖:
2、初始化Watcher
3、在Activity或Fragment中添加检测
4、测试
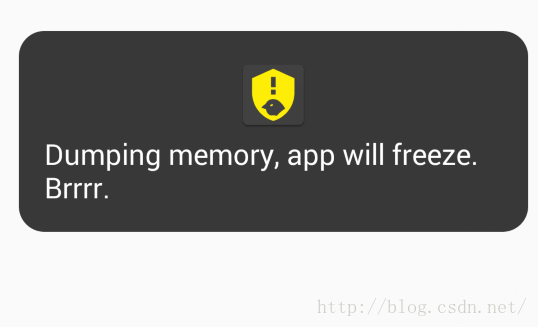
5、测试结果
a、Toast显示(大概10秒左右显示)
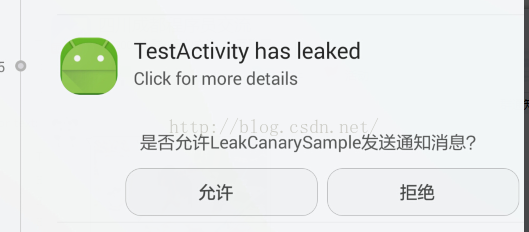
b、通知显示
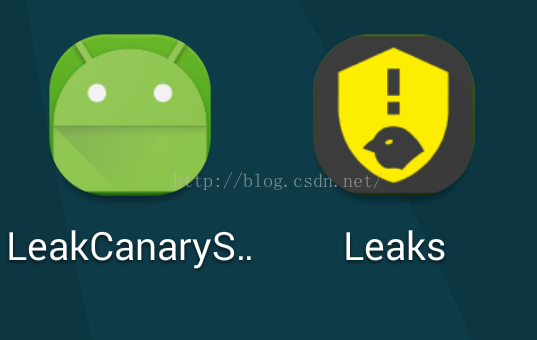
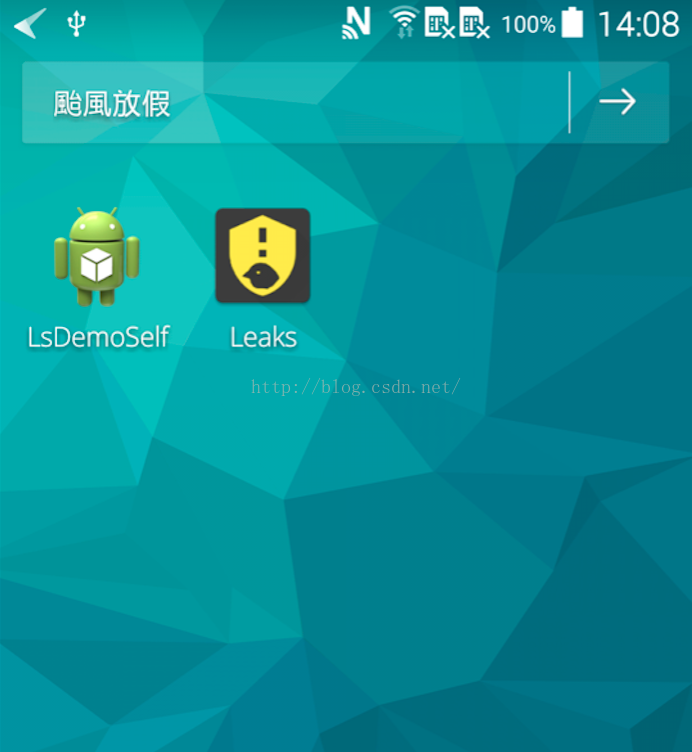
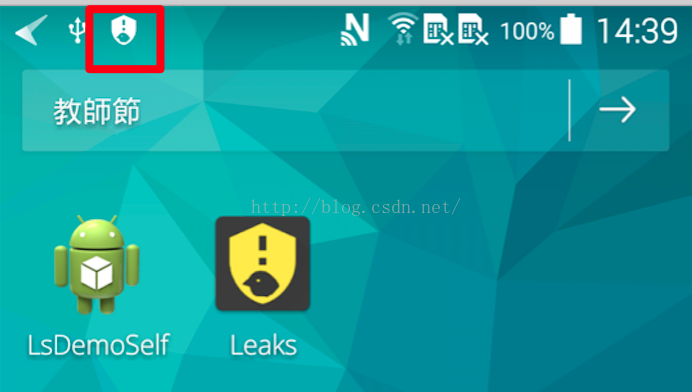
c、桌面自动添加的图表
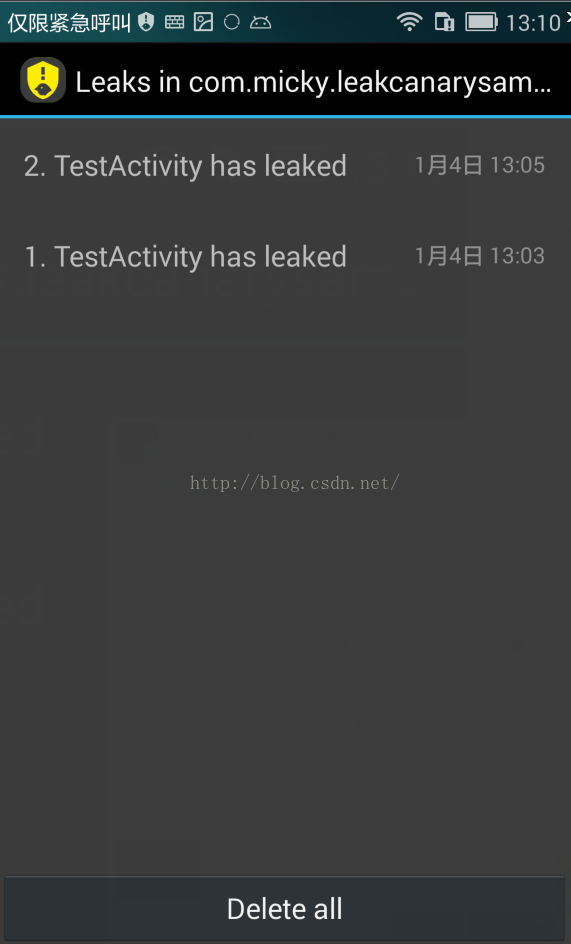
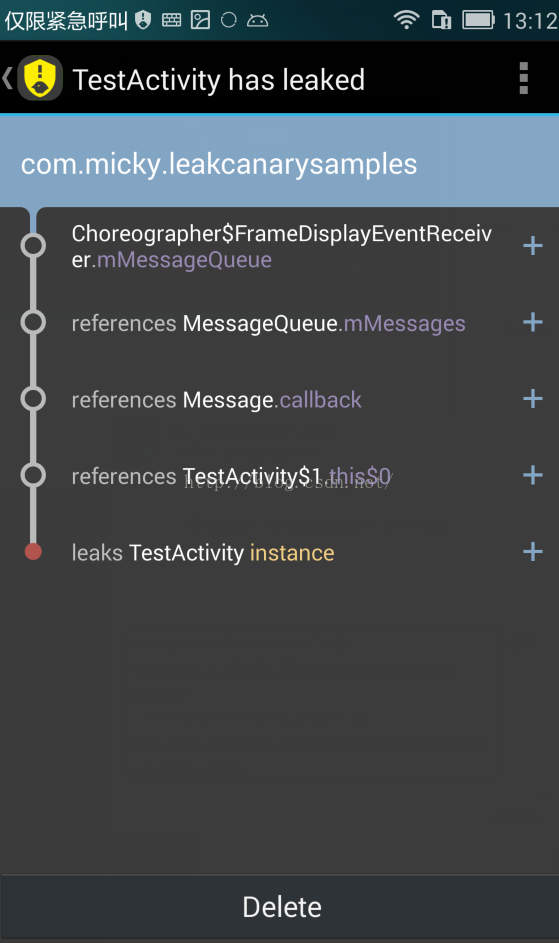
d、内存泄露列表
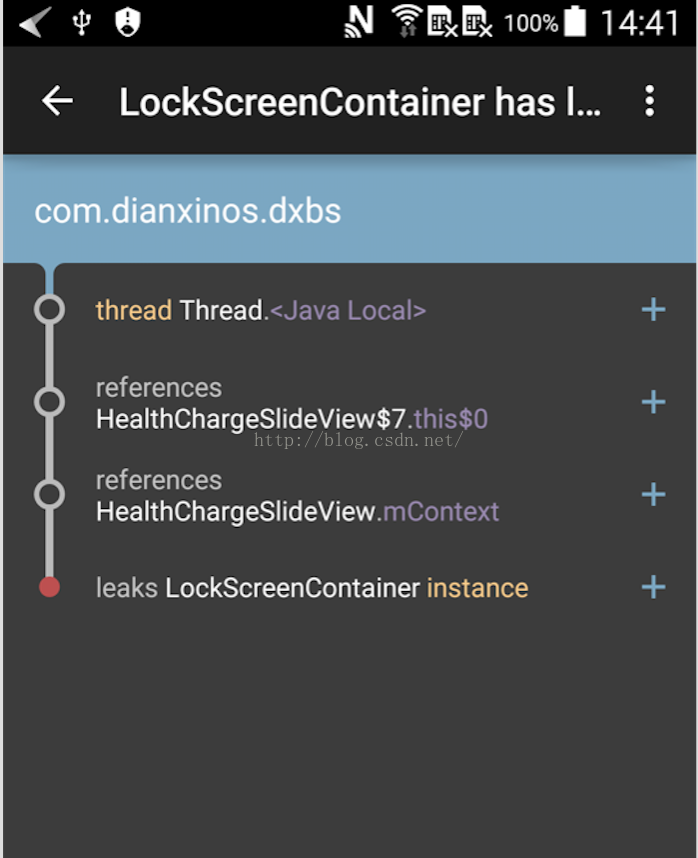
e、内存泄露详细
LogCat可以看到日志日下(hprof文件可以用MAT打开进行分析):
查看自动生成的AndroidManifest文件,LeakCanarySamples/app/build/intermediates/manifests/full/debug/AndroidManifest.xml
如上所示LeakCanary给我们自动添加了两个Service和一个Activity,并添加了对SD卡的读写权限
注:
1、如果在Release模式下请使用RefWatcher.DISABLED
2、在Activity或Fragment 的 Destroy方法中添加检测(很好理解,就是判断一个Activity或Fragment想要被销毁的时候,是否还有其他对象持有其引用导致Activity或Fragment不能被回收,从而导致内存泄露)
源码地址:https://github.com/mickyliu945/LeakCanarySample 点击打开链接
-------------------------------------
为什么我应该使用LeakCanary?
问得好!我们正好写了个博客回答这个问题。 ps:博客在本站的中文地址: LeakCanary:检测所有的内存泄漏
那怎么使用它呢?
使用一个RefWatcher观察引用什么时候应该被GC:
- RefWatcher refWatcher = {...};
- // We expect schrodingerCat to be gone soon (or not), let's watch it.
- refWatcher.watch(schrodingerCat);
LeakCanary.install() 返回一个先前配置的RefWatcher,它也安装一个ActivityRefWatcher以便在Activity.onDestroy()被调用后自动检测Activity是否出现泄露。
- public class ExampleApplication extends Application {
- public static RefWatcher getRefWatcher(Context context) {
- ExampleApplication application = (ExampleApplication) context.getApplicationContext();
- return application.refWatcher;
- }
- private RefWatcher refWatcher;
- @Override public void onCreate() {
- super.onCreate();
- refWatcher = LeakCanary.install(this);
- }
- }
你可以使用RefWatcher观察Fragment的内存泄露
- public abstract class BaseFragment extends Fragment {
- @Override public void onDestroy() {
- super.onDestroy();
- RefWatcher refWatcher = ExampleApplication.getRefWatcher(getActivity());
- refWatcher.watch(this);
- }
- }
How does it work?
1.RefWatcher.watch()创建一个KeyedWeakReference去检测对象;
2.接着,在后台线程,它将会检查是否有引用在不是GC触发的情况下需要被清除的;
3.如果引用引用仍然没有被清除,将会转储堆到.hprof文件到系统文件中(it them dumps the heap into a .hprof file stored on the app file system.)
4.HeapAnalyzerService是在一个分离的进程中开始的,HeapAnalyzer通过使用HAHA解析heap dump;
5.由于一个特殊的引用key和定位的泄露引用,HeapAnalyzer可以在heap dump中找到KeyedWeakReference;
6.如果有一个泄露,HeapAnalyzer计算到GC Roots的最短的强引用路径,然后创建造成泄露的引用链;
7.结果在app的进程中传回到DisplayLeakService,并展示泄露的通知消息;
怎样拷贝leak trace?
你可以在Logcat上看leak trace:
- In com.example.leakcanary:1.0:1 com.example.leakcanary.MainActivity has leaked:
- * GC ROOT thread java.lang.Thread.<Java Local> (named 'AsyncTask #1')
- * references com.example.leakcanary.MainActivity$3.this$0 (anonymous class extends android.os.AsyncTask)
- * leaks com.example.leakcanary.MainActivity instance
- * Reference Key: e71f3bf5-d786-4145-8539-584afaecad1d
- * Device: Genymotion generic Google Nexus 6 - 5.1.0 - API 22 - 1440x2560 vbox86p
- * Android Version: 5.1 API: 22
- * Durations: watch=5086ms, gc=110ms, heap dump=435ms, analysis=2086ms
你也可以分享leak trace和heap dump文件通过action bar的菜单。
My leak is caused by the SDK implementation!
随着时间过去越来越多熟知的内存泄露问题被制造商在android开源项目中修复。当这样一个泄露发生时,你能作为一个应用程序开发员来修复它。出于这个原因,LeakCanary有一个内置Android泄露的列表AndroidExcludedRefs.java来监测它,如果你找到一个新的泄露,请用leaktrace创建一个issue,标明设备和Android版本。如果你提供一个heap dump的文件链接就更好了。
这是对于新发布的Android版本来说是特别重要的。你有机会更早地帮助检测新的内存泄露,这有益于整个Android社区。
开发版快照可以通过Sonatype's snapshots repository找到。
Beyond the leak trace
有时leak trace不够清晰,你需要使用MAT和YourKit深入研究heap dump。这里教你怎样在head dump找到泄露的实例:
1.找出包com.squareup.leakcanary.KeyedWeakReference下所有实例;
2.对于每个实例,考虑它的key域;
3.找到 KeyedWeakReference 有一个key域等于被LeakCanary报出的引用的key;
4.KeyedWeakReference的referent域是程序中内存泄露的对象;
5.从那时起,问题就转到你的手上了。一个好的开始是找到最短的GC roots的路径(排除弱引用)
自定义Customizing
图标和标签 Icon and label
DisplayLeakActivity自带一个默认的icon和label,可以通过提供的R.drawable.leak_canary_icon和R.string.leak_canary_display_activity_label来修改:
- res/
- drawable-hdpi/
- __leak_canary_icon.png
- drawable-mdpi/
- __leak_canary_icon.png
- drawable-xhdpi/
- __leak_canary_icon.png
- drawable-xxhdpi/
- __leak_canary_icon.png
- drawable-xxxhdpi/
- __leak_canary_icon.png
- <?xml version="1.0" encoding="utf-8"?>
- <resources>
- <string name="__leak_canary_display_activity_label">MyLeaks</string>
- </resources>
储存leak traces
DisplayLeakActivity可以在你的app目录保存7个heap dumps和leak traces,你可以在app中通过提供R.integer.__leak_canary_max_stored_leaks的值改变这个数量:
- <?xml version="1.0" encoding="utf-8"?>
- <resources>
- <integer name="__leak_canary_max_stored_leaks">20</integer>
- </resources>
上传到服务器
你可以改变默认的行为去上传leak trace并heap dump到你选择的服务器。
创建你自己的AbstractAnalysisResultService,最容易的方式是在你debug的源码中继承DefaultAnalysisResultService:
- public class LeakUploadService extends DefaultAnalysisResultService {
- @Override protected void afterDefaultHandling(HeapDump heapDump, AnalysisResult result, String leakInfo) {
- if (!result.leakFound || result.excludedLeak) {
- return;
- }
- myServer.uploadLeakBlocking(heapDump.heapDumpFile, leakInfo);
- }
- }
确定在你正式发布的Application类中使RefWatcher失效:
- public class ExampleApplication extends Application {
- public static RefWatcher getRefWatcher(Context context) {
- ExampleApplication application = (ExampleApplication) context.getApplicationContext();
- return application.refWatcher;
- }
- private RefWatcher refWatcher;
- @Override public void onCreate() {
- super.onCreate();
- refWatcher = installLeakCanary();
- }
- protected RefWatcher installLeakCanary() {
- return RefWatcher.DISABLED;
- }
- }
在你的debug的Application类创建一个定制的RefWatcher:
- public class DebugExampleApplication extends ExampleApplication {
- protected RefWatcher installLeakCanary() {
- return LeakCanary.install(app, LeakUploadService.class);
- }
- }
不要忘记了在你debug的manifest中注册service:
- <?xml version="1.0" encoding="utf-8"?>
- <manifest xmlns:android="http://schemas.android.com/apk/res/android"
- xmlns:tools="http://schemas.android.com/tools"
- >
- <application android:name="com.example.DebugExampleApplication">
- <service android:name="com.example.LeakUploadService" />
- </application>
- </manifest>


 518
518


 被折叠的 条评论
为什么被折叠?
被折叠的 条评论
为什么被折叠?
 到【灌水乐园】发言


