


之前在弄echart结合百度地图,折腾了了一段时间。现在做个记录。免的自己睡一觉就忘记。
先说自己使用的 echarts3 和 2其实不一样。api也不想通。一开始浪费了不少时间
先说一下引入的东西吧这个是 核心 值需要这4件就可以了
//百度地图api的ak
<script src="http://api.map.baidu.com/api?v=2.0&ak=XlQ9m3CqMs1UKUbuPIN15LsDp7VC6hoM"></script>
//jquery
<script src="js/jquery-2.1.1.js"></script>
//echarts 3官网下载的
<script src="js/echarts.js"></script>
//一个地图辅助。是 百度地图api下的
<script src="js/bmap.min.js"></script>
完整的html内容如下
<!DOCTYPE html>
<html>
<head>
<meta charset="UTF-8">
<title>Insert title here</title>
<script src="http://api.map.baidu.com/api?v=2.0&ak=XlQ9m3CqMs1UKUbuPIN15LsDp7VC6hoM"></script>
<script src="js/jquery-2.1.1.js"></script>
<script src="js/echarts.js"></script>
<script src="js/bmap.min.js"></script>
</head>
<body>
<!-- 为ECharts准备一个具备大小(宽高)的Dom -->
<div id="main" style="width: 95%; height:2500px;"></div> //窗口原始大小
<script type="text/javascript">
// 基于准备好的dom,初始化echarts实例
var myChart = echarts.init(document.getElementById('main'));
var hightpx = "height:" + ((window.screen.availHeight) - 100) + "px";//窗口根据显示器大小做调整
$("#main").attr("style", hightpx)//窗口根据显示器大小做调整
var last_point = [0, 0];
var t_pos = {
left: 0,
top: 0
}
var startPoint = { //页面初始化坐标点
x: 104.114129,
y: 37.550339
};
// 地图自定义样式
var bmap = {
center: [startPoint.x, startPoint.y],
zoom: 5,
roam: true,
mapStyle: {
styleJson: [{
"featureType": "all",
"elementType": "all",
"stylers": {
"lightness": 47,
"saturation": -100
}
}, {
"featureType": "highway",
"elementType": "geometry.fill",
"stylers": {
"color": "#ffffff"
}
}, {
"featureType": "poi",
"elementType": "labels.icon",
"stylers": {
"visibility": "off"
}
}, {
"featureType": "road",
"elementType": "labels",
"stylers": {
"visibility": "off"
}
}]
}
}
var geoCoordMap = {
'上海': [121.4648, 31.2891],
'东莞': [113.8953, 22.901],
'东营': [118.7073, 37.5513],
'中山': [113.4229, 22.478],
'临汾': [111.4783, 36.1615],
'临沂': [118.3118, 35.2936],
'丹东': [124.541, 40.4242],
'丽水': [119.5642, 28.1854],
'乌鲁木齐': [87.9236, 43.5883],
'佛山': [112.8955, 23.1097],
'保定': [115.0488, 39.0948],
'兰州': [103.5901, 36.3043],
'包头': [110.3467, 41.4899],
'北京': [116.4551, 40.2539],
'北海': [109.314, 21.6211],
'南京': [118.8062, 31.9208],
'南宁': [108.479, 23.1152],
'南昌': [116.0046, 28.6633],
'南通': [121.1023, 32.1625],
'厦门': [118.1689, 24.6478],
'台州': [121.1353, 28.6688],
'合肥': [117.29, 32.0581],
'呼和浩特': [111.4124, 40.4901],
'咸阳': [108.4131, 34.8706],
'哈尔滨': [127.9688, 45.368],
'唐山': [118.4766, 39.6826],
'嘉兴': [120.9155, 30.6354],
'大同': [113.7854, 39.8035],
'大连': [122.2229, 39.4409],
'天津': [117.4219, 39.4189],
'太原': [112.3352, 37.9413],
'威海': [121.9482, 37.1393],
'宁波': [121.5967, 29.6466],
'宝鸡': [107.1826, 34.3433],
'宿迁': [118.5535, 33.7775],
'常州': [119.4543, 31.5582],
'广州': [113.5107, 23.2196],
'廊坊': [116.521, 39.0509],
'延安': [109.1052, 36.4252],
'张家口': [115.1477, 40.8527],
'徐州': [117.5208, 34.3268],
'德州': [116.6858, 37.2107],
'惠州': [114.6204, 23.1647],
'成都': [103.9526, 30.7617],
'扬州': [119.4653, 32.8162],
'承德': [117.5757, 41.4075],
'拉萨': [91.1865, 30.1465],
'无锡': [120.3442, 31.5527],
'日照': [119.2786, 35.5023],
'昆明': [102.9199, 25.4663],
'杭州': [119.5313, 29.8773],
'枣庄': [117.323, 34.8926],
'柳州': [109.3799, 24.9774],
'株洲': [113.5327, 27.0319],
'武汉': [114.3896, 30.6628],
'汕头': [117.1692, 23.3405],
'江门': [112.6318, 22.1484],
'沈阳': [123.1238, 42.1216],
'沧州': [116.8286, 38.2104],
'河源': [114.917, 23.9722],
'泉州': [118.3228, 25.1147],
'泰安': [117.0264, 36.0516],
'泰州': [120.0586, 32.5525],
'济南': [117.1582, 36.8701],
'济宁': [116.8286, 35.3375],
'海口': [110.3893, 19.8516],
'淄博': [118.0371, 36.6064],
'淮安': [118.927, 33.4039],
'深圳': [114.5435, 22.5439],
'清远': [112.9175, 24.3292],
'温州': [120.498, 27.8119],
'渭南': [109.7864, 35.0299],
'湖州': [119.8608, 30.7782],
'湘潭': [112.5439, 27.7075],
'滨州': [117.8174, 37.4963],
'潍坊': [119.0918, 36.524],
'烟台': [120.7397, 37.5128],
'玉溪': [101.9312, 23.8898],
'珠海': [113.7305, 22.1155],
'盐城': [120.2234, 33.5577],
'盘锦': [121.9482, 41.0449],
'石家庄': [114.4995, 38.1006],
'福州': [119.4543, 25.9222],
'秦皇岛': [119.2126, 40.0232],
'绍兴': [120.564, 29.7565],
'聊城': [115.9167, 36.4032],
'肇庆': [112.1265, 23.5822],
'舟山': [122.2559, 30.2234],
'苏州': [120.6519, 31.3989],
'莱芜': [117.6526, 36.2714],
'菏泽': [115.6201, 35.2057],
'营口': [122.4316, 40.4297],
'葫芦岛': [120.1575, 40.578],
'衡水': [115.8838, 37.7161],
'衢州': [118.6853, 28.8666],
'西宁': [101.4038, 36.8207],
'西安': [109.1162, 34.2004],
'贵阳': [106.6992, 26.7682],
'连云港': [119.1248, 34.552],
'邢台': [114.8071, 37.2821],
'邯郸': [114.4775, 36.535],
'郑州': [113.4668, 34.6234],
'鄂尔多斯': [108.9734, 39.2487],
'重庆': [107.7539, 30.1904],
'金华': [120.0037, 29.1028],
'铜川': [109.0393, 35.1947],
'银川': [106.3586, 38.1775],
'镇江': [119.4763, 31.9702],
'长春': [125.8154, 44.2584],
'长沙': [113.0823, 28.2568],
'长治': [112.8625, 36.4746],
'阳泉': [113.4778, 38.0951],
'青岛': [120.4651, 36.3373],
'韶关': [113.7964, 24.7028]
};
var BJData = [
[{
name: '北京'
}, {
name: '上海',
value: 95
}],
[{
name: '北京'
}, {
name: '广州',
value: 90
}],
[{
name: '北京'
}, {
name: '大连',
value: 80
}],
[{
name: '北京'
}, {
name: '南宁',
value: 70
}],
[{
name: '北京'
}, {
name: '南昌',
value: 60
}],
[{
name: '北京'
}, {
name: '拉萨',
value: 50
}],
[{
name: '北京'
}, {
name: '长春',
value: 40
}],
[{
name: '北京'
}, {
name: '包头',
value: 30
}],
[{
name: '北京'
}, {
name: '重庆',
value: 20
}],
[{
name: '北京'
}, {
name: '常州',
value: 10
}]
];
var SHData = [
[{
name: '上海'
}, {
name: '包头',
value: 95
}],
[{
name: '上海'
}, {
name: '昆明',
value: 90
}],
[{
name: '上海'
}, {
name: '广州',
value: 80
}],
[{
name: '上海'
}, {
name: '郑州',
value: 70
}],
[{
name: '上海'
}, {
name: '长春',
value: 60
}],
[{
name: '上海'
}, {
name: '重庆',
value: 50
}],
[{
name: '上海'
}, {
name: '长沙',
value: 40
}],
[{
name: '上海'
}, {
name: '北京',
value: 30
}],
[{
name: '上海'
}, {
name: '丹东',
value: 20
}],
[{
name: '上海'
}, {
name: '大连',
value: 10
}]
];
var planePath = 'path://M1705.06,1318.313v-89.254l-319.9-221.799l0.073-208.063c0.521-84.662-26.629-121.796-63.961-121.491c-37.332-0.305-64.482,36.829-63.961,121.491l0.073,208.063l-319.9,221.799v89.254l330.343-157.288l12.238,241.308l-134.449,92.931l0.531,42.034l175.125-42.917l175.125,42.917l0.531-42.034l-134.449-92.931l12.238-241.308L1705.06,1318.313z';
var convertData = function(data) {
var res = [];
for (var i = 0; i < data.length; i++) {
var dataItem = data[i];
var fromCoord = geoCoordMap[dataItem[0].name];
var toCoord = geoCoordMap[dataItem[1].name];
if (fromCoord && toCoord) {
res.push({
fromName: dataItem[0].name,
toName: dataItem[1].name,
coords: [fromCoord, toCoord]
});
}
}
return res;
};
var color = ['#a6c84c', '#ffa022', '#46bee9'];
var series = [];
[
['北京', BJData],
['上海', SHData]
].forEach(function(item, i) {
series.push({
name: item[0] + ' Top10',
type: 'effectScatter', //飞机航班出发点的特效
coordinateSystem: 'bmap',
zlevel: 2,
rippleEffect: {
brushType: 'stroke'
},
label: {
normal: {
show: true,
position: 'right',
formatter: '{b}'
}
},
symbolSize: function(val) {
return val[2] / 4;
},
showEffectOn: 'render',
itemStyle: {
normal: {
color: color[i]
}
},
data: [{
name: item[0], //
value: geoCoordMap[item[0]].concat([100])
}]
}, {
name: item[0] + ' Top10',
type: 'lines', //飞机尾部的脱线特效
coordinateSystem: 'bmap',
zlevel: 1,
effect: {
show: true,
period: 6,
trailLength: 0.7,
color: '#fff',
symbolSize: 3
},
lineStyle: {
normal: {
color: color[i],
width: 0,
curveness: 0.2
}
},
data: convertData(item[1])
}, {
name: item[0] + ' Top10',
type: 'lines', //飞机的移动轨迹
coordinateSystem: 'bmap',
zlevel: 2,
effect: {
show: true,
period: 6,
trailLength: 0,
symbol: planePath,//飞机图形
symbolSize: 15
},
lineStyle: {
normal: {
color: color[i],
width: 1,
opacity: 0.4,
curveness: 0.2
}
},
data: convertData(item[1])
}, {
name: item[0] + ' Top10',
type: 'effectScatter', //到达点的特效
coordinateSystem: 'bmap',
zlevel: 2,
rippleEffect: {
brushType: 'stroke'
},
label: {
normal: {
show: true,
position: 'right',
formatter: '{b}'
}
},
symbolSize: function(val) {
return val[2] / 4;
},
showEffectOn: 'render',
itemStyle: {
normal: {
color: color[i]
}
},
data: item[1].map(function(dataItem) {
return {
name: dataItem[1].name,
value: geoCoordMap[dataItem[1].name].concat([dataItem[1].value])
};
})
});
});
option = {
bmap: bmap,
color: ['gold', 'aqua', 'lime'],
backgroundColor: '#404a59',
title: { //标题等等信息
text: '模拟迁徙+百度地图',
subtext: 'data-visual.cn',
sublink:'http://data-visual.cn',
left: 'center',
textStyle: {
color: '#fff'
}
},
tooltip: {
trigger: 'item',
transitionDuration: 0,
position: function(point, params, dom, rect, size) { //鼠标移到点上,显示内容的位置设置
var least_area = 20;
var offset_x = 30; /* 相对于point的偏移 */
var offset_y = 30;
/* last_point的least_area范围内不会产生新的t_pos */
if (Math.abs(point[0] - last_point[0]) < least_area &&
Math.abs(point[1] - last_point[1]) < least_area &&
counter >= 2) {
return t_pos;
}
if (Math.abs(point[0] - last_point[0]) >= least_area ||
Math.abs(point[1] - last_point[1]) >= least_area) {
counter = 0;
}
counter += 1;
/* 使real_x,real_y有数值 */
if (counter == 1) {
t_pos.left = point[0] + offset_x;
t_pos.top = point[1] + offset_y;
last_point = [point[0], point[1]];
}
/* 此处进行修正tooltip的位置 */
if (counter == 2) {
var real_x = $(dom).position().left;
var real_y = $(dom).position().top;
t_pos.left += point[0] - real_x + offset_x;
t_pos.top += point[1] - real_y + offset_y;
}
// alert(t_pos.left + ' : ' +t_pos.top)
return t_pos;
},
formatter: function(params) {
// alert(params.name + ' : ' + params.value[2])
return params.name+ params.value[0]+"-"+params.value[1]
}
},
legend: { //工具栏,可以进行 类型数据显示的选择
orient: 'vertical',
top: 'bottom',
left: 'right',
data: ['北京 Top10', '上海 Top10'],
textStyle: {
color: '#fff'
},
selectedMode: 'single'
},
series: [ {
name: '武汉',
type: 'effectScatter', //飞机航班出发点的特效
coordinateSystem: 'bmap',
zlevel: 2,
rippleEffect: {
brushType: 'stroke'
},
label: {
normal: {
show: true,
position: 'right',
formatter: '{b}'
}
},
symbolSize: function(val) {
return 20;
},
showEffectOn: 'render',
itemStyle: {
normal: {
color: '#B6A2DE'
}
},
data: [{
name: "武汉", //
value: [114.3896, 30.6628],
}]
} ,
{
name: '上海',
type: 'effectScatter', //飞机航班出发点的特效
coordinateSystem: 'bmap',
zlevel: 2,
rippleEffect: {
brushType: 'stroke'
},
label: {
normal: {
show: true,
position: 'right',
formatter: '{b}'
}
},
symbolSize: function(val) {
return 20;
},
showEffectOn: 'render',
itemStyle: {
normal: {
color: '#B6A2DE'
}
},
data: [{
name: "上海", //
value: [121.4648, 31.2891]
}]
} ,
{
name: '北京',
type: 'effectScatter', //飞机航班出发点的特效
coordinateSystem: 'bmap',
zlevel: 2,
rippleEffect: {
brushType: 'stroke'
},
label: {
normal: {
show: true,
position: 'right',
formatter: '{b}'
}
},
symbolSize: function(val) {
return 20;
},
showEffectOn: 'render',
itemStyle: {
normal: {
color: '#B6A2DE'
}
},
data: [{
name: "北京", //
value: [116.4551, 40.2539]
}]
},
{
name: '广州',
type: 'effectScatter', //飞机航班出发点的特效
coordinateSystem: 'bmap',
zlevel: 2,
rippleEffect: {
brushType: 'stroke'
},
label: {
normal: {
show: true,
position: 'right',
formatter: '{b}'
}
},
symbolSize: function(val) {
return 20;
},
showEffectOn: 'render',
itemStyle: {
normal: {
color: '#B6A2DE'
}
},
data: [{
name: "广州", //
value: [113.5107, 23.2196]
}]
},
//线特效
{
type: 'lines',
coordinateSystem: 'bmap', // 线连接, 只需要坐标,为 起点和终点
zlevel: 2,
effect: {
show: true,
period: 6,
trailLength: 0,
symbol: 'path://M1705.06,1318.313v-89.254l-319.9-221.799l0.073-208.063c0.521-84.662-26.629-121.796-63.961-121.491c-37.332-0.305-64.482,36.829-63.961,121.491l0.073,208.063l-319.9,221.799v89.254l330.343-157.288l12.238,241.308l-134.449,92.931l0.531,42.034l175.125-42.917l175.125,42.917l0.531-42.034l-134.449-92.931l12.238-241.308L1705.06,1318.313z',//飞机图形
symbolSize: 15
},
lineStyle: {
normal: {
color: '#ED868C',
width: 1,
opacity: 0.4,
curveness: 0
}
},
data: [{ fromName: '上海', toName: '北京', coords: [ [121.4648, 31.2891],[116.4551, 40.2539]]}]
},
{
type: 'lines',
coordinateSystem: 'bmap', // 线连接, 只需要坐标,为 起点和终点
zlevel: 2,
effect: {
show: true,
period: 6,
trailLength: 0,
symbol: 'path://M1705.06,1318.313v-89.254l-319.9-221.799l0.073-208.063c0.521-84.662-26.629-121.796-63.961-121.491c-37.332-0.305-64.482,36.829-63.961,121.491l0.073,208.063l-319.9,221.799v89.254l330.343-157.288l12.238,241.308l-134.449,92.931l0.531,42.034l175.125-42.917l175.125,42.917l0.531-42.034l-134.449-92.931l12.238-241.308L1705.06,1318.313z',//飞机图形
symbolSize: 15
},
lineStyle: {
normal: {
color: '#ED868C',
width: 1,
opacity: 0.4,
curveness: 0
}
},
data: [{ fromName: '北京', toName: '武汉', coords: [ [116.4551, 40.2539],[114.3896, 30.6628]]}]
},
{
type: 'lines',
coordinateSystem: 'bmap', // 线连接, 只需要坐标,为 起点和终点
zlevel: 2,
effect: {
show: true,
period: 6,
trailLength: 0,
symbol: 'path://M1705.06,1318.313v-89.254l-319.9-221.799l0.073-208.063c0.521-84.662-26.629-121.796-63.961-121.491c-37.332-0.305-64.482,36.829-63.961,121.491l0.073,208.063l-319.9,221.799v89.254l330.343-157.288l12.238,241.308l-134.449,92.931l0.531,42.034l175.125-42.917l175.125,42.917l0.531-42.034l-134.449-92.931l12.238-241.308L1705.06,1318.313z',//飞机图形
symbolSize: 15
},
lineStyle: {
normal: {
color: '#ED868C',
width: 1,
opacity: 0.4,
curveness: 0
}
},
data: [{ fromName: '武汉', toName: '广州', coords: [ [114.3896, 30.6628],[113.5107, 23.2196]]}]
}
]
};
// 使用刚指定的配置项和数据显示图表。
myChart.setOption(option);
</script>
</body>
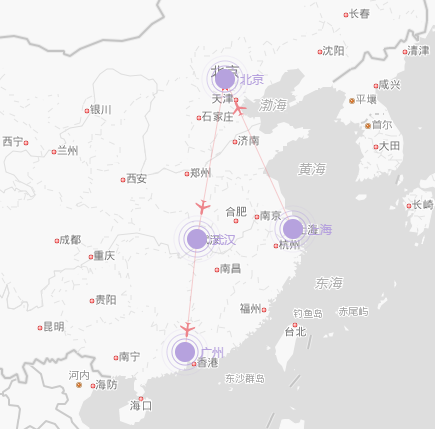
</html>这是基于一个 demo的示例上改的,为了理清思路,数据显示也没有用用循环,而是使用的单个模式,便于新手理解,
熟悉以后可以使用 集合 迭代添加数据。 想使用原版数据可以 改一下这里
将series: [ { 改成 series: series 就会使用demo的原始数据, 迭代模式的
series: [ {
附上一个最精简版本。带循环数据的。应该一目了然了
<!DOCTYPE html>
<html>
<head>
<meta charset="UTF-8">
<title>Insert title here</title>
<script src="http://api.map.baidu.com/api?v=2.0&ak=XlQ9m3CqMs1UKUbuPIN15LsDp7VC6hoM"></script>
<script src="js/jquery-2.1.1.js"></script>
<script src="js/echarts.js"></script>
<script src="js/bmap.min.js"></script>
</head>
<body>
 <!-- 为ECharts准备一个具备大小(宽高)的Dom -->
    <div id="main" style="width: 95%; height:2500px;"></div>
    <script type="text/javascript">
        // 基于准备好的dom,初始化echarts实例
        var myChart = echarts.init(document.getElementById('main'));
        var hightpx = "height:" + ((window.screen.availHeight) - 100) + "px";
        $("#main").attr("style", hightpx)
        var color = ['#a6c84c', '#ffa022', '#46bee9'];
        var last_point = [0, 0];
			var t_pos = {
				    left: 0,
				    top: 0
				}
        var startPoint = {  //页面初始化坐标点
        	    x: 114.254722,
        	    y: 30.550605
        	};
        	// 地图自定义样式
        	var bmap = {
        	    center: [startPoint.x, startPoint.y],
        	    zoom: 15,
        	    roam: true,
        	    mapStyle: {
    	            styleJson: [{
    	                "featureType": "all",
    	                "elementType": "all",
    	                "stylers": {
    	                    "lightness": 47,
    	                    "saturation": -100
    	                }
    	            }, {
    	                "featureType": "highway",
    	                "elementType": "geometry.fill",
    	                "stylers": {
    	                    "color": "#ffffff"
    	                }
    	            }, {
    	                "featureType": "poi",
    	                "elementType": "labels.icon",
    	                "stylers": {
    	                    "visibility": "off"
    	                }
    	            }, {
    	                "featureType": "road",
    	                "elementType": "labels",
    	                "stylers": {
    	                    "visibility": "off"
    	                }
    	            }]
    	        }
        	}

        	var addr = [
			[{ name: '琴台大剧院' }, {  jd:114.2592716217 , wd: 30.5616327403 }],
			[{ name: '钟家村' }, {  jd:114.26728 , wd: 30.549565 }],
			[{ name: '汉阳区江堤街江堤社区北方向' }, {  jd:114.2530059814 , wd: 30.5378686275 }],
			[{ name: '汉阳大道钟家村公交站' }, {  jd:114.254722 , wd: 30.550605 }]

        	];


			var series2 = [];
        	addr.forEach(function(item, i) {
        	    series2.push({
        	        name:  addr[i][0].name ,
        	        type: 'effectScatter',   // 坐标点数据
        	        coordinateSystem: 'bmap',
        	        zlevel: 2,
        	        rippleEffect: {
        	            brushType: 'stroke'
        	        },
        	        label: {
        	            normal: {
        	                show: true,
        	                position: 'right',
        	                formatter: '{b}'
        	            }
        	        },
        	        symbolSize:  20,
        	        showEffectOn: 'render',
        	        itemStyle: {
        	            normal: {
        	                color: '#2EC7C9'
        	            }
        	        },
        	        data: [{
        	            name: addr[i][0].name,
						value: [addr[i][1].jd, addr[i][1].wd]
        	        }]
        	    }  );
        	});


			addr.forEach(function(item, i) {
				if(i<addr.length-1){
					var endNum=i+1;
					series2.push({
					   type: 'lines',
						coordinateSystem: 'bmap',  // 线连接,  只需要坐标,为 起点和终点
						zlevel: 2,
						effect: {
							show: true,
							period: 6,
							trailLength: 0,
							symbol:'circle',
							symbolSize: 10
						},
						lineStyle: {
							normal: {
								color: '#5AB1EF',
								width: 1,
								opacity: 0.4,
								curveness: 0
							}
						},
						data: [{  coords: [ [addr[i][1].jd,addr[i][1].wd],[addr[endNum][1].jd,addr[endNum][1].wd]]}]
					});
				}
        	});


			addr.forEach(function(item, i) {
				if(i<addr.length-1){
					var endNum=i+1;         //点移动的拖尾特效
					series2.push({
							type: 'lines',
							coordinateSystem: 'bmap',
							zlevel: 1,
							effect: {
								show: true,
								period: 6,
								trailLength: 0.7,
								color: '#5AB1EF',
								symbolSize: 3
							},
							lineStyle: {
								normal: {
									color: color[i],
									width: 0,
									curveness: 0.0
								}
							},
							data: [{  coords: [ [addr[i][1].jd,addr[i][1].wd],[addr[endNum][1].jd,addr[endNum][1].wd]]}]
					});
				}
        	});


        	var color = ['#a6c84c', '#ffa022', '#46bee9'];

        	option = {
        	    bmap: bmap,
				zoom: 13,
        	    color: ['gold', 'aqua', 'lime'],
        	    backgroundColor: '#404a59',
        	    title: {    //标题等等信息
        	        text: '模拟迁徙+百度地图',
        	        subtext: 'data-visual.cn',
        	        sublink:'http://data-visual.cn',
        	        left: 'center',
        	        textStyle: {
        	            color: '#fff'
        	        }
        	    },
       	    tooltip: {
        	    	 trigger: 'item',
         	        transitionDuration: 0,
         	        position: function(point, params, dom, rect, size) {
         	            var least_area = 20;
         	            var offset_x = 30;  // 相对于point的偏移
         	            var offset_y = 30;

         	            // last_point的least_area范围内不会产生新的t_pos
         	            if (Math.abs(point[0] - last_point[0]) < least_area &&
         	                Math.abs(point[1] - last_point[1]) < least_area &&
         	                counter >= 2) {
         	                return t_pos;
         	            }
         	            if (Math.abs(point[0] - last_point[0]) >= least_area ||
         	                Math.abs(point[1] - last_point[1]) >= least_area) {
         	                counter = 0;
         	            }
         	            counter += 1;
         	           // 使real_x,real_y有数值
         	            if (counter == 1) {
         	                t_pos.left = point[0] + offset_x;
         	                t_pos.top = point[1] + offset_y;
         	                last_point = [point[0], point[1]];
         	            }
         	            // 此处进行修正tooltip的位置
         	            if (counter == 2) {
         	                var real_x = $(dom).position().left;
         	                var real_y = $(dom).position().top;
         	                t_pos.left += point[0] - real_x + offset_x;
         	                t_pos.top += point[1] - real_y + offset_y;
         	            }
         	       //     alert(t_pos.left + ' : ' +t_pos.top)
         	            return t_pos;
         	        }
        	    },
        	    legend: {   //工具栏,可以进行 类型数据显示的选择
        	        orient: 'vertical',
        	        top: 'bottom',
        	        left: 'right',

        	        textStyle: {
        	            color: '#fff'
        	        },
        	        selectedMode: 'single'
        	    },
        	    series:    series2


            };


        // 使用刚指定的配置项和数据显示图表。
        myChart.setOption(option);
    </script>


</body>
</html>


 1万+
1万+

 被折叠的 条评论
为什么被折叠?
被折叠的 条评论
为什么被折叠?
 到【灌水乐园】发言


