


http://rstudio-pubs-static.s3.amazonaws.com/1876_df0bf890dd54461f98719b461d987c3d.html
考虑到原地址可能失效,这里做简单的翻译和备份,有关聚类的R包可以参考cluster包和ape包
以下是正文:
The most basic dendrogram
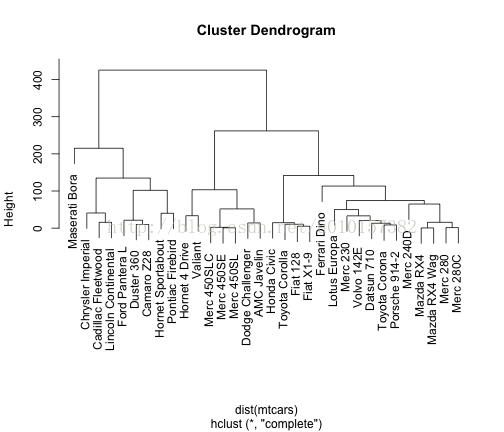
Let's start with the most basic type of dendrogram. For that purpose we'll use themtcars dataset and we'll calculate a hierarchical clustering with the functionhclust (with the default options).
让我们从最基本聚类树状图开始。为此目的,我们将使用mtcars数据集和我们计算的层次聚类hclust函数(与默认选项)。
# prepare hierarchical cluster 生成层次聚类hc = hclust(dist(mtcars))
# very simple dendrogram 默认画法
plot(hc)
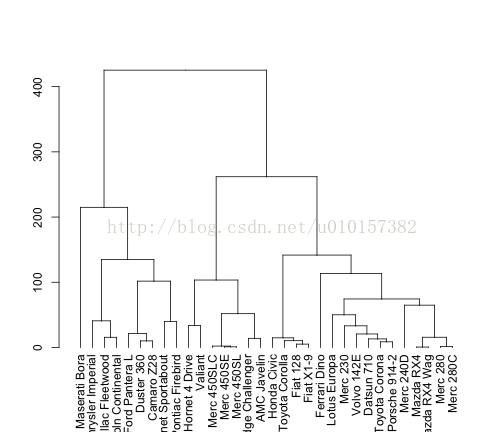
We can put the labels of the leafs at the same level like this
我们可以将样本定义在同一水平 (实在不明白help一下plot函数)

A less basic dendrogram
In order to add more format to the dendrograms, we need to tweek the right parameters. For instance, we could get the following graphic (just for illustration purposes!)
一个更基本的树状图
为了增加更多格式的图,我们需要修改正确的参数。例如,我们可以得到下面的图形(仅作说明用途!)
par(op)
##这里强调一下,par()是对图进行自动调整,貌似功能还挺强大的。新浪有位哥们儿总结得特别好,附赠地址:
http://blog.sina.com.cn/s/blog_8f5b2a2e0102v0tf.html
貌似可以靠par()函数调整图的坐标轴什么的,我没试过哦~~
Alternative dendrograms
An alternative way to produce dendrograms is to specifically convert hclust objects into dendrograms objects另类聚类图
将hclude生成的对象转换为另类的聚类图
# using dendrogram objects
hcd = as.dendrogram(hc)
# alternative way to get a dendrogram
plot(hcd)
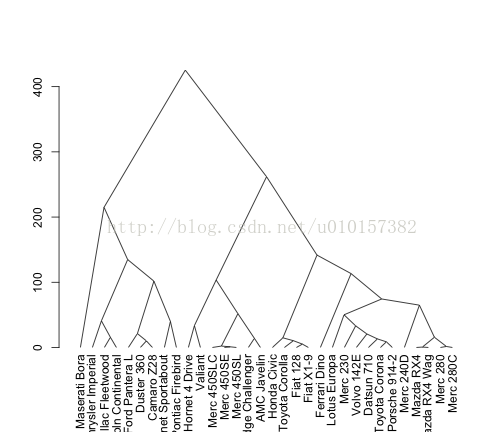
Having an object of class dendrogram, we can also plot the branches in a triangular form
画完这个画三角形的
Zooming-in on dendrograms
Another very useful option is the ability to inspect selected parts of a given tree. For instance, if we wanted to examine the top partitions of the dendrogram, we could cut it at a height of 75
放大在树状图
另一个非常有用的功能是选择树的一部分。例如,如果我们要研究的树状图上的分区,我们可以把它在一个高度75
# plot dendrogram with some cutsop = par(mfrow = c(2, 1))
plot(cut(hcd, h = 75)$upper, main = "Upper tree of cut at h=75")
plot(cut(hcd, h = 75)$lower[[2]], main = "Second branch of lower tree with cut at h=75")

par(op)
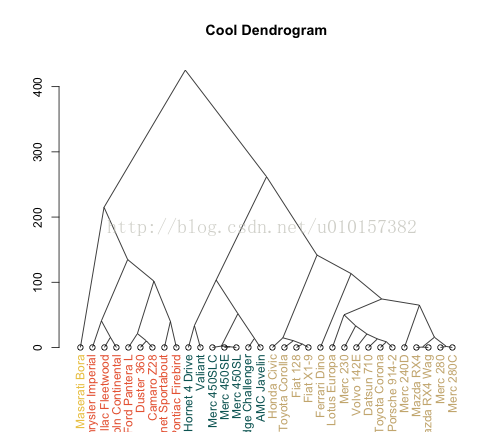
Customized dendrograms
In order to get more customized graphics we need a little bit of more code. A very useful resource is the functiondendrapply that can be used to apply a function to all nodes of a dendrgoram. This comes very handy if we want to add some color to the labels.
为了获得更多的定制的图形,我们需要更多的代码。一个非常有用的功能dendrapply可以应用一个函数的一dendrgoram所有节点。如果我们要添加一些色彩的标签这是非常方便的。
# vector of colors labelColors = c('red', 'blue', 'darkgreen', 'darkgrey',
# 'purple')
labelColors = c("#CDB380", "#036564", "#EB6841", "#EDC951")
# cut dendrogram in 4 clusters
clusMember = cutree(hc, 4)
# function to get color labels
colLab <- function(n) {
    if (is.leaf(n)) {
        a <- attributes(n)
        labCol <- labelColors[clusMember[which(names(clusMember) == a$label)]]
        attr(n, "nodePar") <- c(a$nodePar, lab.col = labCol)
    }
    n
}
# using dendrapply
clusDendro = dendrapply(hcd, colLab)
# make plot
plot(clusDendro, main = "Cool Dendrogram", type = "triangle")
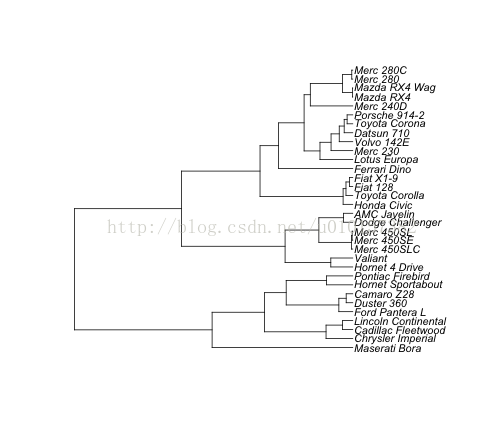
Phylogenetic trees
A very nice tool for displaying more appealing trees is provided by the R packageape. In this case, what we need is to convert thehclust objects intophylo pbjects with the funtions as.phylo
系统进化树
由R包ape提供更具吸引力的树非常好的工具,我们利用as.phylo功能将hclust objects转换成phylo对象
# load package ape; remember to install it: install.packages('ape')library(ape)
# plot basic tree
plot(as.phylo(hc), cex = 0.9, label.offset = 1)
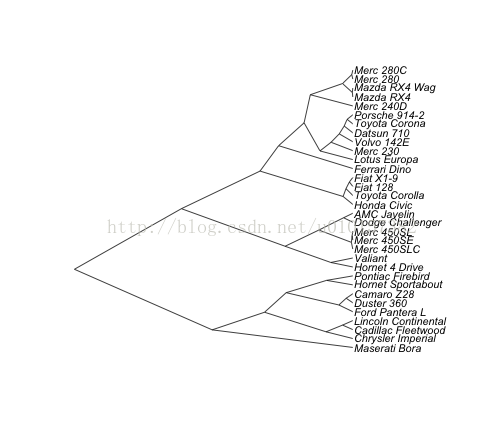
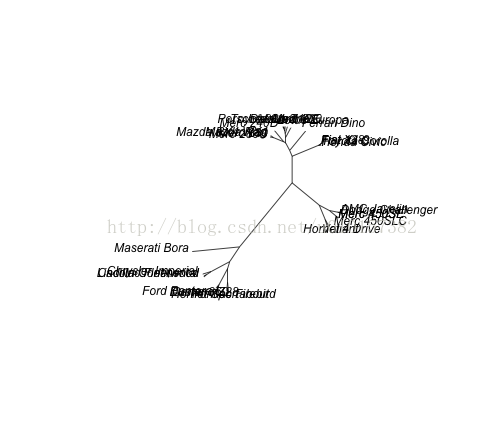
The plot.phylo function has four more different types for plotting a dendrogram. Here they are:
plot.phylo函数的4种不同类型的聚类树形图
# cladogram
plot(as.phylo(hc), type = "cladogram", cex = 0.9, label.offset = 1)
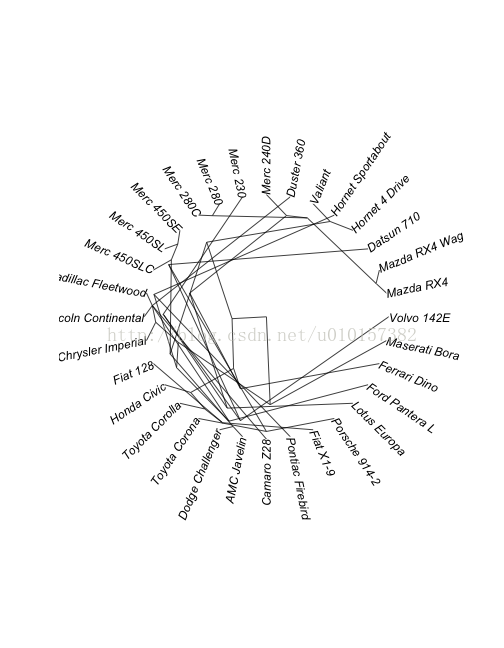
# unrooted
plot(as.phylo(hc), type = "unrooted")
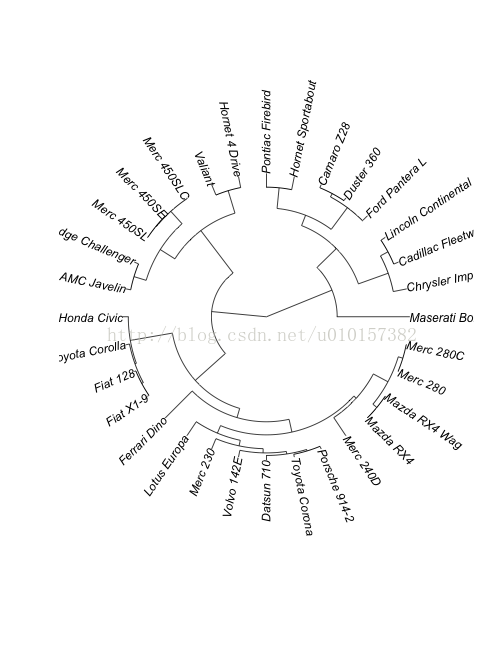
下面是我最喜欢的圆形树形图
# fan
plot(as.phylo(hc), type = "fan")
# radial
plot(as.phylo(hc), type = "radial")
Customizing phylogenetic trees
What I really like about the ape package is that we have more control on the appearance of the dendrograms, being able to customize them in different ways. For example:
自定义的系统进化树
ape 包对树的性状有着很多控制,能够定制他们以不同的方式。例如:
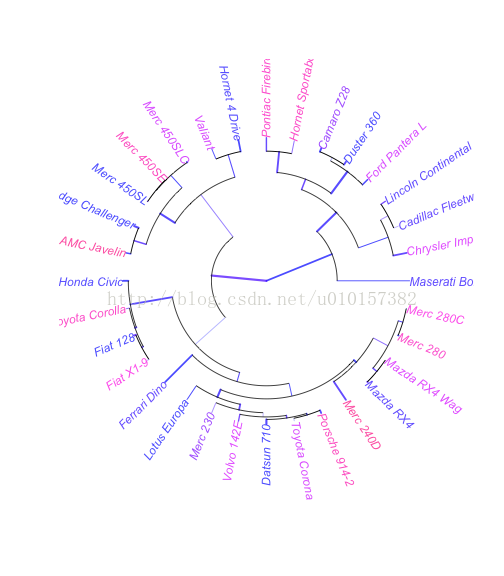
# add colors randomly
plot(as.phylo(hc), type = "fan", tip.color = hsv(runif(15, 0.65,
    0.95), 1, 1, 0.7), edge.color = hsv(runif(10, 0.65, 0.75), 1, 1, 0.7), edge.width = runif(20,
    0.5, 3), use.edge.length = TRUE, col = "gray80")
Again, we can tweek some parameters according to our needs
我们可以根据需求修改一些参数
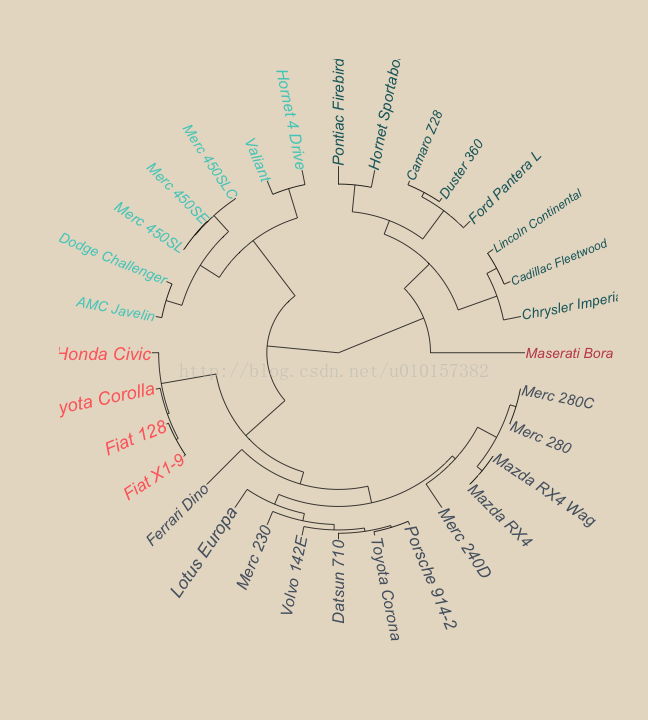
# vector of colors
mypal = c("#556270", "#4ECDC4", "#1B676B", "#FF6B6B", "#C44D58")
# cutting dendrogram in 5 clusters
clus5 = cutree(hc, 5)
# plot
op = par(bg = "#E8DDCB")
# Size reflects miles per gallon
plot(as.phylo(hc), type = "fan", tip.color = mypal[clus5], label.offset = 1,
    cex = log(mtcars$mpg, 10), col = "red")
par(op)
Color in leaves
彩色叶子节点
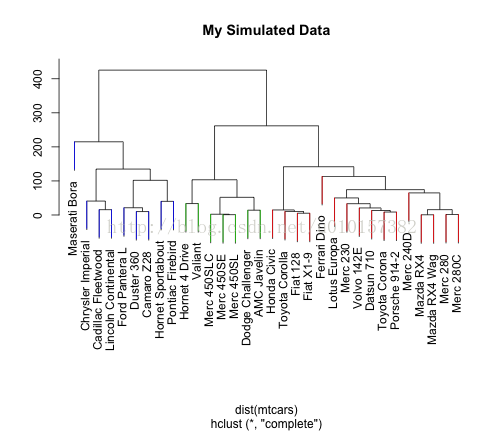
The R package sparcl provides the ColorDendrogram function that allows to add some color. For example, we can add color to the leaves
R包还提供ColorDendrogram功能来让我们给聚类树点颜色看看。比如我们可以给叶子节点来点颜色
# install.packages('sparcl')
library(sparcl)
# colors the leaves of a dendrogram
y = cutree(hc, 3)
ColorDendrogram(hc, y = y, labels = names(y), main = "My Simulated Data",
    branchlength = 80)
ggdendro
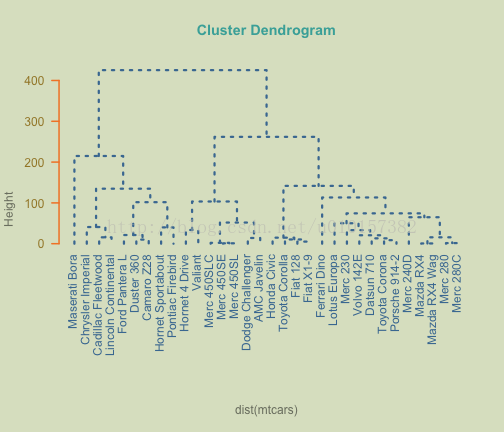
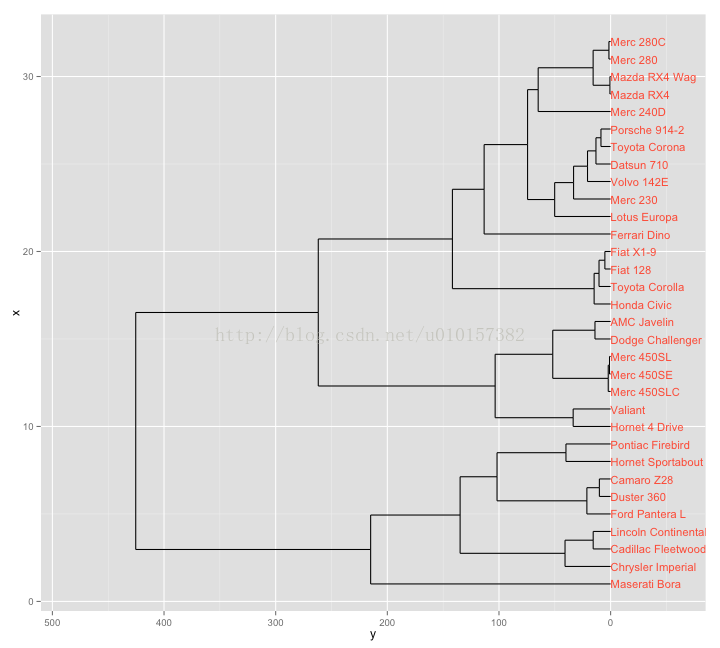
For reasons that are unknown to me, the The R package ggplot2 have no functions to plot dendrograms. However, the ad-hoc packageggdendro offers a decent solution. You would expect to have more customization options, but so far they are rather limited. Anyway, for those of us who are ggploters this is another tool in our toolkit.
R包ggplot2没有功能绘制树状图的原因我不知道。然而,包ggdendro提供一个像样的解决方案。你希望有更多的自定义选项,但到目前为止他们相当有限。不管怎样,对于我们这些谁是ggploters这是我们工具的另一个工具。
# install.packages('ggdendro')
library(ggdendro)
# basic option
ggdendrogram(hc)

# another option
ggdendrogram(hc, rotate = TRUE, size = 4, theme_dendro = FALSE, color = "tomato")
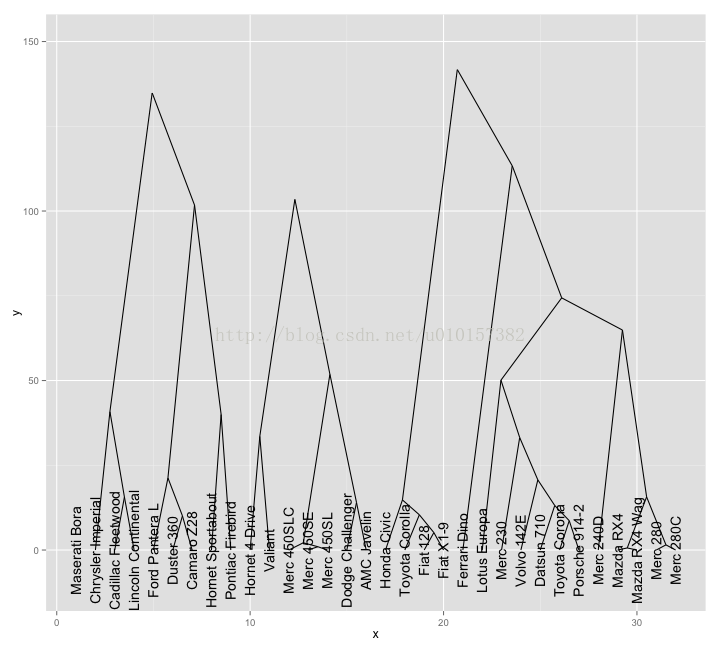
# Triangular lines
ddata <- dendro_data(as.dendrogram(hc), type = "triangle")
ggplot(segment(ddata)) + geom_segment(aes(x = x, y = y, xend = xend,
yend = yend)) + ylim(-10, 150) + geom_text(data = label(ddata), aes(x = x,
y = y, label = label), angle = 90, lineheight = 0)
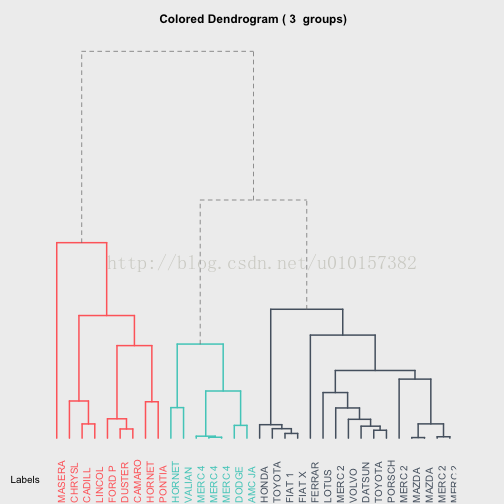
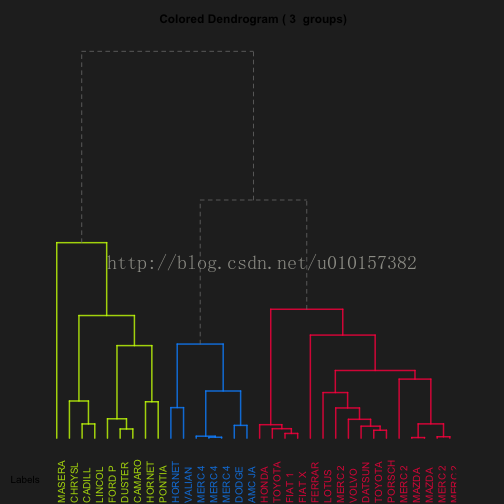
Colored dendrogram
Last but not least, there's one more resource available from Romain Francois'saddicted to Rgraph gallery which I find really interesting. The code in R for generating colored dendrograms, which you can download and modify if wanted so, is availablehere
最后,你可以到罗曼弗朗索瓦的图形库里面进一步学习~~~
你甚至可以修改他的代码
地址是:
http://gallery.r-enthusiasts.com/RGraphGallery.php?graph=79 (貌似要翻墙)
http://addictedtor.free.fr/packages/A2R/lastVersion/R/code.R
# load code of A2R function
source("http://addictedtor.free.fr/packages/A2R/lastVersion/R/code.R")
# colored dendrogram
op = par(bg = "#EFEFEF")
A2Rplot(hc, k = 3, boxes = FALSE, col.up = "gray50", col.down = c("#FF6B6B",
    "#4ECDC4", "#556270"))
par(op)
# another colored dendrogram
op = par(bg = "gray15")
cols = hsv(c(0.2, 0.57, 0.95), 1, 1, 0.8)
A2Rplot(hc, k = 3, boxes = FALSE, col.up = "gray50", col.down = cols)
par(op)


 5532
5532


 被折叠的 条评论
为什么被折叠?
被折叠的 条评论
为什么被折叠?
 到【灌水乐园】发言


