


本篇用highcharts控件展示支出去向图和支出趋势图。
研究了一阵儿,控件挺好用的,而且效果也不错。
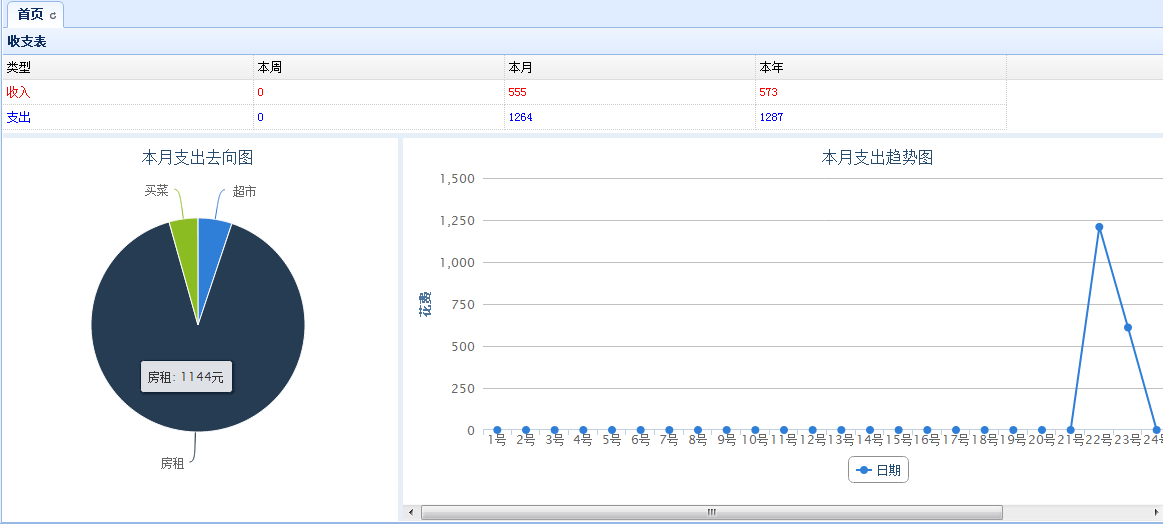
本篇实现家庭财务管理系统首页的展示,参考了一下“随手记”,打算在首页展示以下内容:
1.收支表
收入情况:本周收入,本月收入,本年收入;
支出情况:本周支出,本月支出,本年支出。
2.当月支出去向图,以饼图展示各种类型的支出情况。
3.当月支出趋势图,以线图展示当月每天的支出情况。
首先看1的实现,controller代码如下:
@RequestMapping("/payincome.do")
  @ResponseBody
  public Object getPayincomeData()
  {
    Calendar cal = Calendar.getInstance();
    int year = cal.get(Calendar.YEAR);
    int month = cal.get(Calendar.MONTH) + 1;

    String monday = this.getCurrentMonday();
    String sunday = this.getPreviousSunday();
    String stryear = String.valueOf(year);
    String strmonth = stryear + String.valueOf(month);
    List<Map<String,String>> result = this.commonService.getPayincomeData(stryear,strmonth,monday,sunday);
    return result;
  }
统计本月本年的数据好说,sql中like '201301%'、like ‘2013%’就可以了,统计本周的数据则要拿到本周一到周日的日期,获取本周一周日的代码如下,网上找的:
// 获得当前日期与本周一相差的天数
  private int getMondayPlus()
  {
    Calendar cd = Calendar.getInstance();
    // 获得今天是一周的第几天,星期日是第一天,星期二是第二天......
    int dayOfWeek = cd.get(Calendar.DAY_OF_WEEK);
    if (dayOfWeek == 1)
    {
      return -6;
    } else
    {
      return 2 - dayOfWeek;
    }
  }

  // 获得当前周- 周一的日期
  private String getCurrentMonday()
  {
    int mondayPlus = getMondayPlus();
    GregorianCalendar currentDate = new GregorianCalendar();
    currentDate.add(GregorianCalendar.DATE, mondayPlus);
    Date monday = currentDate.getTime();
    DateFormat df = new SimpleDateFormat("yyyyMMdd");
    String preMonday = df.format(monday);
    return preMonday;
  }

  // 获得当前周- 周日 的日期
  private String getPreviousSunday()
  {
    int mondayPlus = getMondayPlus();
    GregorianCalendar currentDate = new GregorianCalendar();
    currentDate.add(GregorianCalendar.DATE, mondayPlus + 6);
    Date monday = currentDate.getTime();
    DateFormat df = new SimpleDateFormat("yyyyMMdd");
    String preMonday = df.format(monday);
    return preMonday;
  }
参数都准备好了,下面看service的代码:
public List<Map<String, String>> getPayincomeData(String stryear, String strmonth, String monday, String sunday)
  {
    List<Map<String,String>> result = new ArrayList<Map<String,String>>();
    Map<String,String> map = new HashMap<String,String>();
    map.put("paymenttype", "1");
    map.put("monday", monday);
    map.put("sunday", sunday);
    Integer week1 = dao.getWeekSum(map);
    map.put("paymenttype", "2");
    Integer week2 = dao.getWeekSum(map);

    map = new HashMap<String,String>();
    map.put("paymenttype", "1");
    map.put("day", strmonth+"%");
    Integer month1 = dao.getMonthSum(map);
    map.put("paymenttype", "2");
    Integer month2 = dao.getMonthSum(map);

    map = new HashMap<String,String>();
    map.put("paymenttype", "1");
    map.put("day", stryear+"%");
    Integer year1 = dao.getMonthSum(map);
    map.put("paymenttype", "2");
    Integer year2 = dao.getMonthSum(map);

    Map<String,String> data1 = new HashMap<String,String>();
    data1.put("type", "收入");
    data1.put("week", week1 == null?"0":week1.toString());
    data1.put("month", month1 == null?"0":month1.toString());
    data1.put("year", year1 == null?"0":year1.toString());
    result.add(data1);

    data1 = new HashMap<String,String>();
    data1.put("type", "支出");
    data1.put("week", week2 == null?"0":week2.toString());
    data1.put("month", month2 == null?"0":month2.toString());
    data1.put("year", year2 == null?"0":year2.toString());
    result.add(data1);
    return result;
  }
两种数据:收入和支出,paymenttype=1是收入,paymenttype=2是支出,上面代码将周月年的收入支出都统计了一遍,下面是mapper.xml内容:
<select id="getWeekSum" parameterType="Map" resultType="Integer">
        <![CDATA[
        select SUM(value) from payments
        where paymenttype = #{paymenttype} and day >= #{monday} and day <= #{sunday}
         ]]>
    </select>
    <select id="getMonthSum" parameterType="Map" resultType="Integer">
        <![CDATA[
        select SUM(value) from payments
        where paymenttype = #{paymenttype} and day like #{day}
         ]]>
    </select>
<![DATA]]里面的内容表示不是xml标记,如果不加这个,它会把sql里的<号当成xml标记。
下面看2、3的实现:
2、3主要是要获取饼状图和线图的数据,在后台将数据准备好:
@RequestMapping("/getMonthSumByType.do")
  @ResponseBody
  public Object getMonthSumByType()
  {
    Calendar cal = Calendar.getInstance();
    int year = cal.get(Calendar.YEAR);
    int month = cal.get(Calendar.MONTH) + 1;
    String strmonth = String.valueOf(year) + String.valueOf(month);
    int days = cal.getActualMaximum(Calendar.DAY_OF_MONTH);
    Map<String,String> ret = this.commonService.getMonthSumByType(strmonth,days);
    return ret;
  }
getMonthSumByType方法将获取本月的分类支出数据,和本月每天的支出情况,需要两个参数,strmonth:本月月份(201301类似),days:本月有多少天(一个sql应该能统计一个月内每天的支出情况,没想出来怎么写,就用了笨方法,一天一天的取出来的。)。
getMonthSumByType方法如下:
public Map<String, String> getMonthSumByType(String month,int days)
  {
    Map<String,String> retmap = new HashMap<String,String>();
    List<Map> list = this.dao.getMonthSumByType(month + "%");
    String data = "[{name:'花费',data:[";
    for (Map m:list)
    {
      String temp = "['%s',";
      data += String.format(temp, m.get("typename"));
      temp = "%s],";
      data += String.format(temp, m.get("value"));
    }
    if (data.length() > 18)
      data = data.substring(0, data.length() - 1);
    data += "]}]";
    retmap.put("data1", data);

    data = "[{name:'日期',data:[";
    String beginday = month + "01";
    int ibeginday = Integer.parseInt(beginday);
    for (int i = 0; i < days; i++)
    {
      String temp = String.valueOf(ibeginday + i);
      Integer value = this.dao.getDayValue(temp);
      data += String.format("['%d号',", Integer.parseInt(temp.substring(6)));
      data += String.format("%s],", value == null?"0":value.toString());
    }
    if (data.length() > 18)
      data = data.substring(0, data.length() - 1);
    data += "]}]";
    retmap.put("data2", data);
    return retmap;
  }
上面准备了两组数据,data1是饼图数据类似:[{name:'花费',data:[[‘买菜’,100],['房租',10000],['买衣服',1000]]}],data2是线图的数据,类似:[{name:'日期',data:[[‘1号’,100],[‘2号’,100],[‘3号’,100]]}],具体格式可去highcharts查文档。
两个dao方法对应的mapper.xml内容如下:
<select id="getMonthSumByType" parameterType="String" resultType="java.util.HashMap">
        SELECT typename,SUM(VALUE) AS value  FROM vpayments WHERE paymenttype = '2' and day like #{month} GROUP BY TYPE
    </select>
    <select id="getDayValue" parameterType="String" resultType="Integer">
        select sum(value) from payments where day = #{day}
    </select>
下面看首页的jsp代码:
<%@ page language="java" contentType="text/html; charset=utf-8"
    pageEncoding="UTF-8"%>
<%
    String path = request.getContextPath();
    String basePath = request.getScheme() + "://"
            + request.getServerName() + ":" + request.getServerPort()
            + path ;
%>
<script>
$(function(){
	$('#datagrid_payincome').datagrid({//收支表
		title:'收支表',
        url:'<%=basePath%>/payincome.do',
        border:false,
        height:105,
        columns:[[
                  {field:'type',title:'类型',width:250,
                	  styler: function(value,row,index){
                		  if (index == 0)
                              return 'color:red;';
                          else
                              return 'color:blue;';
                      }
                  },
                  {field:'week',title:'本周',width:250,
                      styler: function(value,row,index){
                          if (index == 0)
                              return 'color:red;';
                          else
                              return 'color:blue;';
                      }},
                  {field:'month',title:'本月',width:250,
                          styler: function(value,row,index){
                              if (index == 0)
                                  return 'color:red;';
                              else
                                  return 'color:blue;';
                          }},
                  {field:'year',title:'本年',width:250,
                              styler: function(value,row,index){
                                  if (index == 0)
                                      return 'color:red;';
                                  else
                                      return 'color:blue;';
                              }}
          ]]
    });
	$.ajax({
        type: 'POST',
        url: '<%=basePath%>/getMonthSumByType.do',//请求饼图和线图数据
        data: '',
        dataType:'text',
        success: function(msg){
        	var temp = $.parseJSON(msg);
        	createChart('zcqxt','本月支出去向图',eval(temp.data1),'pie',350,390,'元');
        	createChart('zcqst','本月支出趋势图',eval(temp.data2),'line',360,950,'元');
        }
    });
});
</script>
<div id="layout" class="easyui-layout" data-options="fit:true">
   <div data-options="region:'north',split:true,border:false" style="height:110px">
       <table id="datagrid_payincome"></table>
   </div>
   <div data-options="region:'west',split:true,border:false" style="width:400px">
       <div id="zcqxt"></div>
   </div>
   <div data-options="region:'center',border:false">
       <div id="zcqst"></div>
   </div>
</div>
createChart代码:
function createChart(container,title,yaxisData,chartType,height,width,unit)
{
	options = {
        chart: {
            renderTo: container,
            type: chartType,
            height:height,
            width:width
        },
        title: {
            text: title,
        },
        xAxis: {
            categories: []
        },
        yAxis: {
            min: 0,
            title: {
            	text: '花费'
            }
        },
        tooltip: {
            formatter: function() {
            	return ''+ this.key +': '+this.y + unit;
            }
        },
        plotOptions: {
        	series: {
                allowPointSelect: true
            }
        },
        series: []
    };

	//options.xAxis.categories = xaxisData;
	options.series = yaxisData;
	var chart = new Highcharts.Chart(options);
	return chart;
}
highcharts可去官网看文档,这里只是粗略实现。
下面看截图:


 398
398


 被折叠的 条评论
为什么被折叠?
被折叠的 条评论
为什么被折叠?
 到【灌水乐园】发言


