


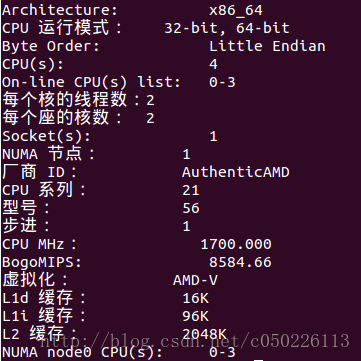
首先先 贴出机器的cpu信息
先看下nginx 的版本信息
nginx/1.9.9 (Ubuntu)修改conf的部分配置
worker_processes  8;
events {
    worker_connections  10240;
}
server {
        listen       80;
        server_name  localhost;
        #charset koi8-r;
        #access_log  logs/host.access.log  main;
        location / {
            root   /home/jiam/work/WWW/PHP/webapp;
            index  index.html index.htm;
        }
}
测试通过
root@jiam-Hi-Fi-A88ZN:/etc# /usr/local/nginx/sbin/nginx -t
nginx: the configuration file /usr/local/nginx/conf/nginx.conf syntax is ok
nginx: configuration file /usr/local/nginx/conf/nginx.conf test is successful
swoole的版本信息
swoole/v2.0.5php版本
PHP 7.1.0 (cli) (built: Jan  1 2017 17:14:13) ( NTS )
Copyright (c) 1997-2016 The PHP Group
Zend Engine v3.1.0-dev, Copyright (c) 1998-2016 Zend Technologies
开启opcache
Zend OPcache

Opcode Caching  Up and Running
Optimization    Enabled
SHM Cache   Enabled
File Cache  Enabled
Startup OK
Shared memory model mmap
Cache hits  0
Cache misses    1
Used memory 9132704
Free memory 57976160
Wasted memory   0
Interned Strings Used memory    145320
Interned Strings Free memory    4048984
Cached scripts  1
Cached keys 1
Max keys    3907
OOM restarts    0
Hash keys restarts  0
Manual restarts 0
php代码
<?php
$http = new Swoole\Http\Server("0.0.0.0", 9510);
$http->set([
    'worker_num' => 8,
    'daemonize' => false,
    'max_request' => 10240,
    'dispatch_mode' => 2,
    'open_cpu_affinity' => true,
    'open_tcp_nodelay' => true
]);
$http->on('Request', function ($request, $response) {
    $response->end('hello world');
});
$http->start();
测试的内容

尽量关闭所有的进程,进行测试
nginx
Server Software:        nginx/1.9.9
Server Hostname:        127.0.0.1
Server Port:            80

Document Path:          /
Document Length:        11 bytes

Concurrency Level:      1000
Time taken for tests:   38.434 seconds
Complete requests:      1000000
Failed requests:        109406
   (Connect: 0, Receive: 0, Length: 109406, Exceptions: 0)
Non-2xx responses:      109406
Total transferred:      252362878 bytes
HTML transferred:       30802486 bytes
Requests per second:    26018.95 [#/sec] (mean)
Time per request:       38.434 [ms] (mean)
Time per request:       0.038 [ms] (mean, across all concurrent requests)
Transfer rate:          6412.32 [Kbytes/sec] received

Connection Times (ms)
              min  mean[+/-sd] median   max
Connect:        0   19  66.6     14    1020
Processing:     1   20   8.2     20     413
Waiting:        1   15   7.9     15     409
Total:          3   38  67.4     35    1225

Percentage of the requests served within a certain time (ms)
  50%     35
  66%     37
  75%     38
  80%     39
  90%     40
  95%     41
  98%     43
  99%     44
 100%   1225 (longest request)
 r  b     swpd     free     buff    cache   si   so    bi    bo   in   cs us sy id wa st
 3  0        0 10427220   333364  2076548    0    0     0     0 25882 52713 14 47 39  0  0
 3  0        0 10419696   333364  2079500    0    0     0     0 32008 64781 12 47 41  0  0
 3  0        0 10415032   333364  2083576    0    0     0     0 32161 64968 11 48 41  0  0
 2  0        0 10411704   333364  2088612    0    0     0     0 29741 59869 12 48 41  0  0
 2  0        0 10408608   333372  2091836    0    0     0    20 33644 67868 10 47 43  0  0
 3  0        0 10403412   333372  2095356    0    0     0     0 31044 63703 17 47 36  0  0
 3  0        0 10400924   333372  2098316    0    0     0     0 29884 60509 13 46 41  0  0
 3  0        0 10395960   333372  2100984    0    0     0     0 31809 66173 14 47 39  0  0
 3  0        0 10390844   333372  2102988    0    0     0     0 33456 67117 14 46 40  0  0
 2  0        0 10387648   333380  2107520    0    0     0    12 31186 63083 12 47 41  0  0
 3  0        0 10380044   333380  2111812    0    0     0     0 31627 64905 13 46 42  0  0
 2  0        0 10378576   333380  2115452    0    0     0     0 36685 74527 12 46 42  0  0
 2  0        0 10370848   333380  2119584    0    0     0     0 36721 73495 11 46 43  0  0
 3  0        0 10366428   333380  2122800    0    0     0     0 32971 66150 10 46 43  0  0
 2  0        0 10361960   333388  2126496    0    0     0    12 34405 68993 11 46 42  1  0
 3  0        0 10356560   333388  2130848    0    0     0     0 31691 63889 11 47 41  0  0
 2  0        0 10354072   333388  2134996    0    0     0     0 32410 64726 12 46 42  0  0
 2  0        0 10348964   333388  2138584    0    0     0     0 33112 67863 15 48 37  0  0
 2  0        0 10340064   333388  2142292    0    0     0     0 31828 63918 12 46 42  0  0
 3  0        0 10345660   333424  2144708    0    0    28 71580 21806 43315  8 36 51  6  0
 2  0        0 10335924   333424  2147340    0    0     0     0 29343 59095 11 48 42  0  0
 3  0        0 10334644   333424  2150308    0    0     0     0 31356 62877 10 48 42  0  0
 4  0        0 10328344   333424  2154856    0    0     0     0 30671 62234 10 48 41  0  0
 1  0        0 10319164   333424  2158696    0    0     0     0 31861 64291 12 47 41  0  0
 3  0        0 10319064   333432  2161532    0    0     0    44 30516 61251 11 48 41  0  0
 3  0        0 10312008   333432  2165348    0    0     0     0 31225 62771 11 47 42  0  0
 2  0        0 10309604   333432  2169000    0    0     0     0 37633 75614 12 47 42  0  0
 2  0        0 10308856   333432  2171764    0    0     0     0 32533 65178 12 47 41  0  0
 2  0        0 10305556   333432  2175180    0    0     0     0 29308 59979 16 46 38  0  0
 2  0        0 10301564   333440  2177396    0    0     0    12 30149 60797 15 47 38  1  0
 2  0        0 10293164   333440  2180696    0    0     0     0 31219 62476 13 46 41  0  0
 3  0        0 10288792   333440  2184152    0    0     0     0 31777 64499 13 45 42  0  0
 3  0        0 10284732   333440  2187996    0    0     0     0 33891 68562 12 46 42  0  0
 2  0        0 10280744   333440  2191760    0    0     0     0 34789 69654 12 45 43  0  0
 3  0        0 10277148   333448  2194716    0    0     0    12 31771 63493 13 45 42  0  0
 2  0        0 10270556   333448  2198496    0    0     0     0 32048 64462 11 47 42  0  0
 2  0        0 10267864   333448  2200976    0    0     0     0 35142 70417 10 49 41  0  0
 1  0        0 10264040   333448  2203440    0    0     0     0 25621 51815 17 34 50  0  0
PHP
Server Software:        swoole-http-server
Server Hostname:        127.0.0.1
Server Port:            9510

Document Path:          /
Document Length:        11 bytes

Concurrency Level:      1000
Time taken for tests:   42.688 seconds
Complete requests:      1000000
Failed requests:        0
Total transferred:      159000000 bytes
HTML transferred:       11000000 bytes
Requests per second:    23426.03 [#/sec] (mean)
Time per request:       42.688 [ms] (mean)
Time per request:       0.043 [ms] (mean, across all concurrent requests)
Transfer rate:          3637.44 [Kbytes/sec] received

Connection Times (ms)
              min  mean[+/-sd] median   max
Connect:        0   21  78.3     18    3016
Processing:     1   22   6.4     22     212
Waiting:        0   16   5.8     16     210
Total:          2   43  78.8     40    3053

Percentage of the requests served within a certain time (ms)
  50%     40
  66%     42
  75%     44
  80%     45
  90%     48
  95%     51
  98%     54
  99%     56
 100%   3053 (longest request)
 r  b     swpd     free     buff    cache   si   so    bi    bo   in   cs us sy id wa st
 2  0        0 12738172   193256   574632    0    0     0     0 25599 103871 18 39 43  0  0
 4  0        0 12734208   193256   574632    0    0     0     0 25245 98287 14 40 46  0  0
 5  0        0 12732096   193256   574632    0    0     0     0 25293 92541 17 39 44  0  0
 1  0        0 12731868   193256   574632    0    0     0     0 25848 95558 13 38 49  0  0
 2  0        0 12729848   193256   574632    0    0     0     4 26207 97075 12 38 50  0  0
 1  0        0 12729848   193256   574632    0    0     0     0 28139 101625 11 39 50  0  0
 2  0        0 12729512   193264   574632    0    0     0    28 26611 96448 11 40 49  0  0
 5  0        0 12728168   193264   574632    0    0     0     0 25343 94227 13 38 49  0  0
 1  0        0 12728272   193264   574632    0    0     0     0 25835 94715 12 38 50  0  0
 2  0        0 12726072   193264   574632    0    0     0     0 25990 92243 11 42 47  0  0
 3  0        0 12725472   193264   574632    0    0     0     0 27623 99533 12 39 49  0  0
 1  0        0 12726140   193264   574632    0    0     0     0 25504 92404 11 39 50  0  0
 3  0        0 12723288   193264   574632    0    0     0     0 26508 95137  9 40 51  0  0
 2  0        0 12723604   193264   574632    0    0     0     0 26174 93852 14 38 48  0  0
 1  0        0 12722612   193264   574632    0    0     0     0 26824 97011 12 40 48  0  0
 4  0        0 12720004   193264   574632    0    0     0     0 25521 93565 10 40 50  0  0
 9  0        0 12720120   193648   574632    0    0   384     0 26291 94406 12 39 48  0  0
 1  0        0 12715688   193656   575032    0    0   408     0 25931 96298 12 38 49  0  0
 3  0        0 12713024   193656   575032    0    0     0     0 25777 94513 11 40 49  0  0
 7  0        0 12713264   193656   575032    0    0     0     0 26336 95179 13 38 49  0  0
 4  0        0 12712752   193656   575032    0    0     0     0 25360 91271 14 38 48  0  0
 2  0        0 12710784   193664   575024    0    0     0    20 25211 92543 12 37 50  1  0
 1  0        0 12711564   193664   575032    0    0     0     0 25116 93098 14 37 50  0  0
 6  0        0 12709160   193664   575032    0    0     0     0 26165 92904 14 39 47  0  0
 2  0        0 12708796   193664   575032    0    0     0     0 26376 96520 11 40 49  0  0
 6  0        0 12708896   193664   575032    0    0     0     0 27037 98341 11 39 49  0  0
 5  0        0 12706024   193664   575032    0    0     0     0 26329 96320 13 38 49  0  0
 3  0        0 12705360   193664   575032    0    0     0     0 26381 95429 13 40 47  0  0
 1  0        0 12705956   193664   575032    0    0     0     0 25351 94709 11 39 50  0  0
 2  0        0 12704736   193664   575032    0    0     0     0 26173 94527 12 39 49  0  0
 4  0        0 12705596   193664   575032    0    0     0     0 25953 94049 11 39 49  0  0
总结
从性能上看 nginx要比swoole 在并发的处理量上高出11个百分比。((26018.95-23426.03)/23426.03 = 11%)
从资源的消耗上看 nginx的cpu负载率在58%到 59%之间,swoole的cpu负载率在51%到 52%之间。


 172
172


 被折叠的 条评论
为什么被折叠?
被折叠的 条评论
为什么被折叠?
 到【灌水乐园】发言


