


 本文详细介绍如何使用pecl安装Xdebug,并通过正确配置PHPStorm实现远程调试功能。包括配置服务器端php.ini文件及PHPStorm的各项调试参数。
1安装Xdebug
用yum安装可能会失败,用pecl安装成功。
#yum installphp-pecl-xdebug.x86_64
pecl installxdebug
如果pecl命令不存在请先安装php-pear
命令:yum install php-pear
注意多加了一项IDE Key,且要与后面PHPStorm中的配置相同:
zend_extension=/path/xdebug.so
zend_debugger.allow_hosts=10.25.1.199
zend_debugger.expose_remotely=always
zend_debugger.httpd_uid=-1
xdebug.auto_trace = on
xdebug.auto_profile = on
xdebug.collect_params = on
xdebug.collect_return = on
xdebug.profiler_enable = on
xdebug.trace_output_dir = "/tmp"
xdebug.profiler_output_dir ="/tmp"
xdebug.dump.GET = *
xdebug.dump.POST = *
xdebug.dump.COOKIE = *
xdebug.dump.SESSION = *
xdebug.var_display_max_data = 4056
xdebug.var_display_max_depth = 5
xdebug.remote_enable=on
xdebug.remote_handler=dbgp
xdebug.remote_host=10.25.1.199
xdebug.remote_port=9010
xdebug.remote_autostart=1
xdebug.idekey="PHPSTORM"
2配置PHPStorm
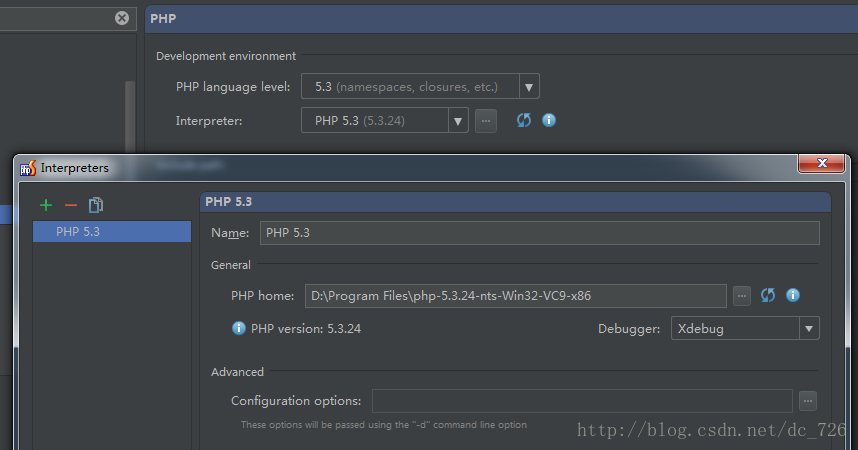
图1:首先配置PHP解释器的路径
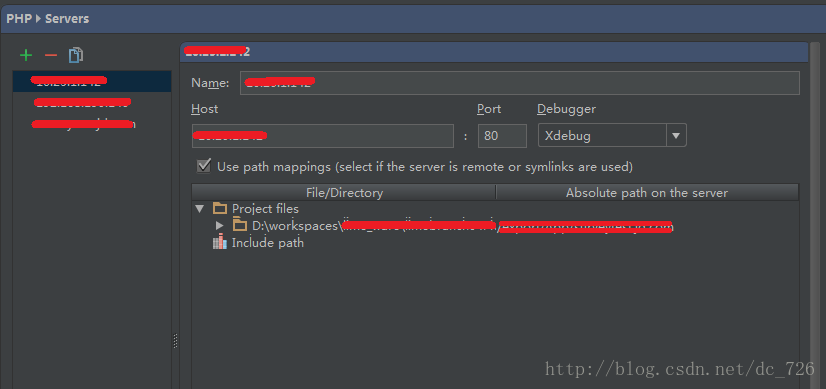
图2:File>Settings>PHP>Servers,这里要填写服务器端的相关信息,name填localhost,host填localhost,port填80,debugger选XDebug
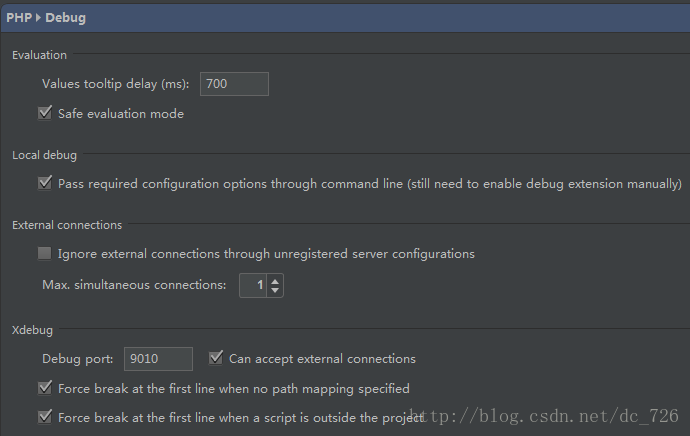
图3:进入File>Settings>PHP>Debug,看到XDebug选项卡,port填9010,其他默认
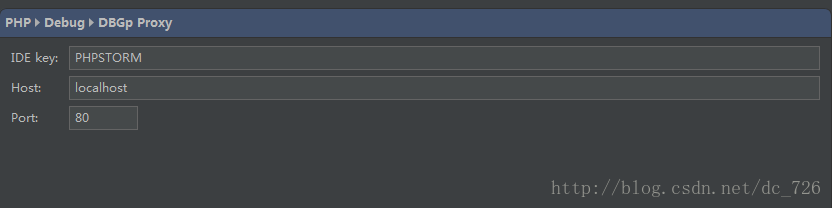
图4:进入File>Settings>PHP>Debug>DBGpProxy,IDE key填PHPSTORM,host填localhost,port 填80
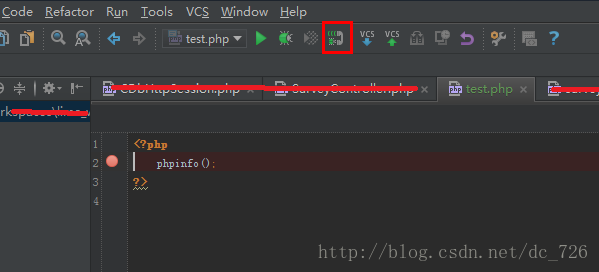
图5:在phpStorm里打开监听,就是一个电话一样的按钮
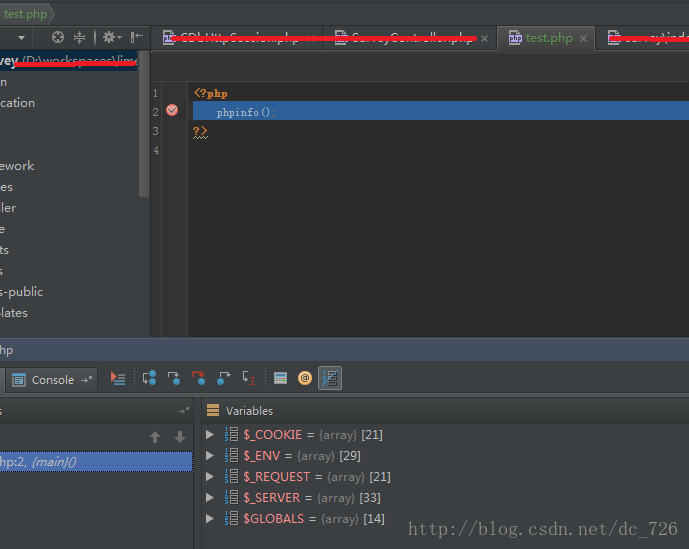
图6:在浏览器里打开XDebug工具,访问localhost,与phpStorm连接成功!
3常见问题
访问页面准备进入断点时,PHPStorm报错:Cannot accept external Xdebug connection: Cannot evaluate expression'isset($_SERVER['PHP_IDE_CONFIG'])';
导致此问题的一个可能原因是:服务器端的php.ini中配置了:
extension=/path/xdebug.so
应该只保留下面一个:
zend_extension=/path/xdebug.so
参考资料
1 phpStorm+XDebug进行断点调试的配置
http://www.chenxuanyi.cn/xampp-phpstorm-xdebug.html
2利用下面网页中的Start debug按钮在COOKIE中设置Xdebug所需的变量。
http://www.jetbrains.com/phpstorm/marklets/
3 Cannot accept external Xdebug connection:Cannot evaluate expression 'isset($_SERVER['PHP_IDE_CONFIG'])


 被折叠的 条评论
为什么被折叠?
被折叠的 条评论
为什么被折叠?
 到【灌水乐园】发言


