


Profile GPU Rendering
Android开发者选项中提供了Profile GPU Rendering功能,用于在屏幕上实时显示GPU渲染每一帧图像花费的时间(单位:ms)。
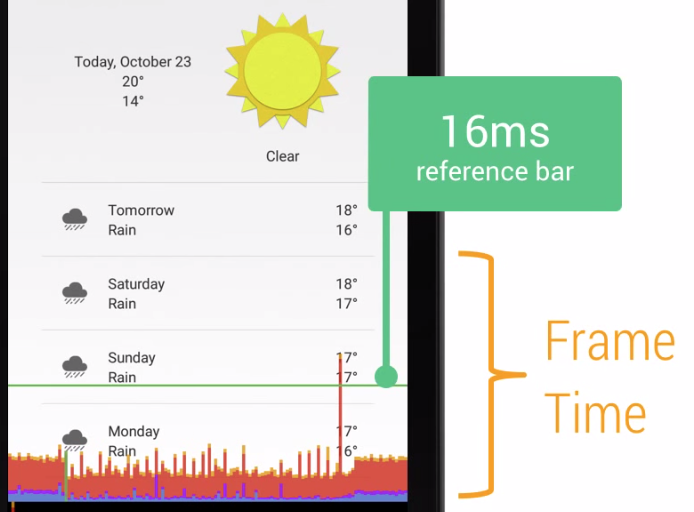
渲染时间用柱状图表示,上面的绿线代表16ms,也就是要尽量保证所有柱状图都在这条线下方。每一条柱状图都由3部分组成,蓝色、红色和黄色,代表渲染的3个不同的阶段,通过分析这三个阶段的时间就可以找到渲染时的性能瓶颈。
蓝色部分表示绘制时间或者在Java层创建和更新display list的时间。在一个View 实际被渲染前,它需要先转换为GPU能识别的格式。简单来说可能就是几个绘制命令,复杂一点,我们可能在嵌入了一条从canvas获取的自定义路径。这一步完成之后,输出结果就会被系统作为display list缓存起来。
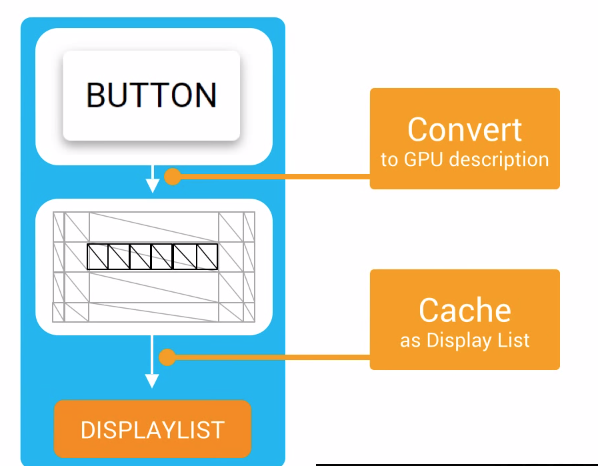

蓝色部分记录了这一帧对所有需要更新的view完成这两步花费的时间。当它很高的时候,说明有很多view突然无效(invalidate)了,或者是有几个自定义view在onDraw函数中做了特别复杂的绘制逻辑。
The blue section of that bar represents draw time or rather how long it took to create and update your display lists in Java. Remember that before a view can actually be rendered, it has to first be transformed into a GPU-friendly format.
On the simple side of this, it could just be a few Draw commands. But on the complex end, we could be tessellating a custom path coming from your canvas object.
Once done ,the results are then cached as a display list object by the system.
This blue bar is recording how much time it takes to complete these two steps for all the views that need to be updated on the screen this frame.
When you see this bar shoot high, it could mean that a bunch of views suddenly became invalidated, or it may be a few custom views who might have some extremely complex logic in their onDraw funtion.
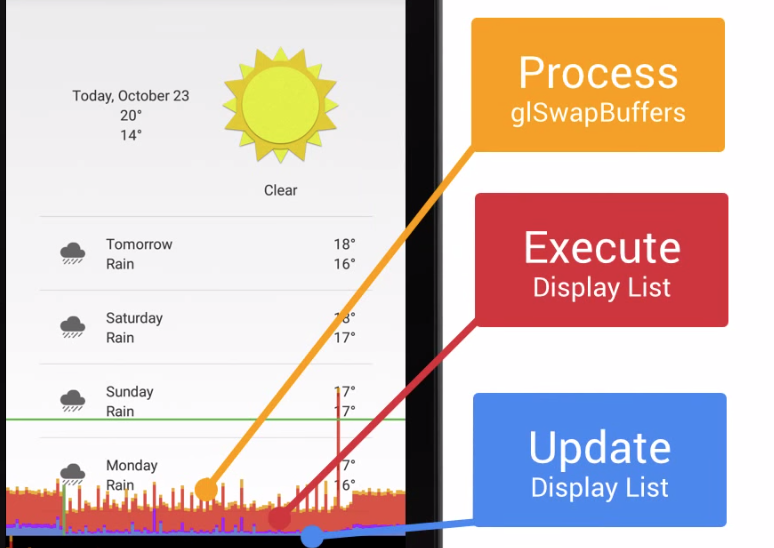
红色部分代表执行时间,也就是Android 2D渲染引擎(OpenGL)执行display list的时间。为了将变化绘制在屏幕上,Android需要使用OpenGL ES API来绘制这些display list信息,OpenGL最终将数据传给了GPU,然后GPU渲染到屏幕上。View越复杂,OpenGL绘制所需要的命令也越复杂。如果红色这一段比较高,复杂的view都可能是罪魁祸首。还有值得注意的是比较大的峰值,这说明有些view重复提交了,也就是绘制了多次,而它们可能并不需要重绘。
The red section of the bar represents execute time.This is the time spent by Android’s 2D renderer to execute display list.
See, in order to draw to the screen, Android needs to draw your display list information by interacting with the OpenGL ES API which effectively passes along data to the GPU, which then, ultimately, ends up putting pixels on the screen. Remember that for more complex views like a custom view, the more complex the commands needed for OpenGL to draw it.
And when you see this red bar shoot high, these complex views are a likely culprit.
It’s also worth noting that large spikes in this bar can come from re-submitting a load of views to be redrawn again. These views haven’t necessarily been invalidated. But if something happens, like a view rotates, then we need to Go back and clean up areas of the screen that might be affected by that redrawing the views underneath it.
橙色部分代表处理时间,更进一步,就是CPU告诉GPU渲染已经完成的时间。这部分是阻塞的,CPU会等待GPU知道确认收到了命令,如果这里比较高,说明GPU做的任务太多了,通常是由于很多复杂的view绘制从而需要过多的OpenGL渲染命令去处理。
The oragen section of the bar represents the process time. Or rather, this is where the CPU tells the GPU that it’s done rendering a frame. This action is a blocking call, and as such the CPU will sit around and wait for the GPU to acknowledge that it’s received the command. If this bar is getting large, then it means that you’re doing a lot of work on the GPU resulting from many complex views that require a lot of OpenGL rendering commands to be processed.
CPU 与 GPU
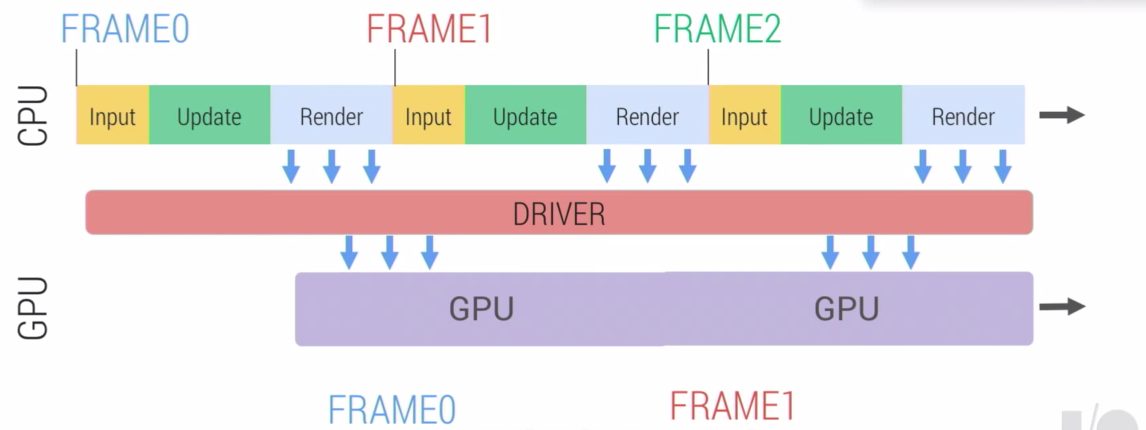
现代的图形API不允许CPU直接与GPU通信,而是通过中间的一个图形驱动层(Graphics Driver)来连接这两部分。
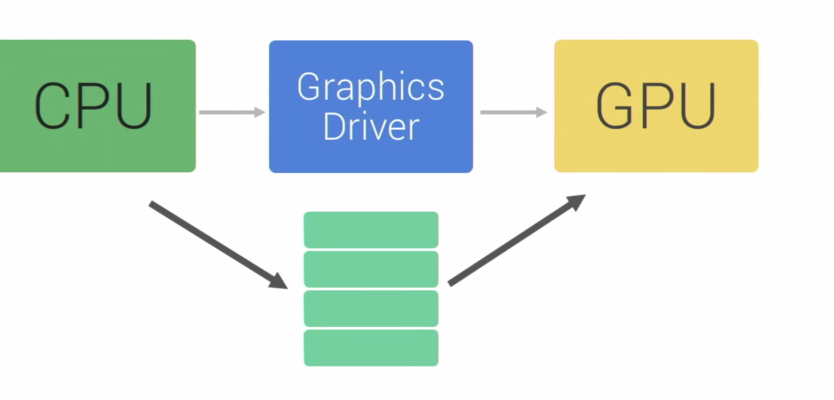
图形驱动维护了一个队列,CPU把display list添加到队列里,GPU从这个队列取出数据进行绘制。
Refefence
Android Performance Patterns: Tool - Profile GPU Rendering
Perf Primer : CPU, GPU and your Android game


 1029
1029


 被折叠的 条评论
为什么被折叠?
被折叠的 条评论
为什么被折叠?
 到【灌水乐园】发言


