


测试环境
- OS: Linux Red Hat 4.4.7-11
- Memery: 16G
- CPU: 4 Processor(Intel(R) Xeon(R))
- JDK:1.8
- Web服务器r: Tomcat 7.x
- 测试工具: Jmeter-2.9
- Monitor Tools: jconsole,jvisualvm,jstat
Prepare
Run a simple servlet at the Server container,as exclude Application delay,It just return a echo word.
Reference
- Cient Thread: Mock User Request
- Average: Response Time,unit:ms
- Throughput: Query per Second,The formula is: Throughput = (number of requests) / (total time).
- Maxthreads:The maximum num of connections that the server will accept and process.
Case 1
Server parameters as default
maxThread: 200
| Client Thread | Average | Throughput | load average |
|---|---|---|---|
| 100 | 230 | 422 | <1 |
| 500 | 317 | 1545 | <1 |
| 1000 | 382 | 2415 | <1 |
| 1500 | 3269 | 197 | <1 |
As the table shows,The Throughput increase with the client's increase.But it decrease obviousely when client num over 1000.
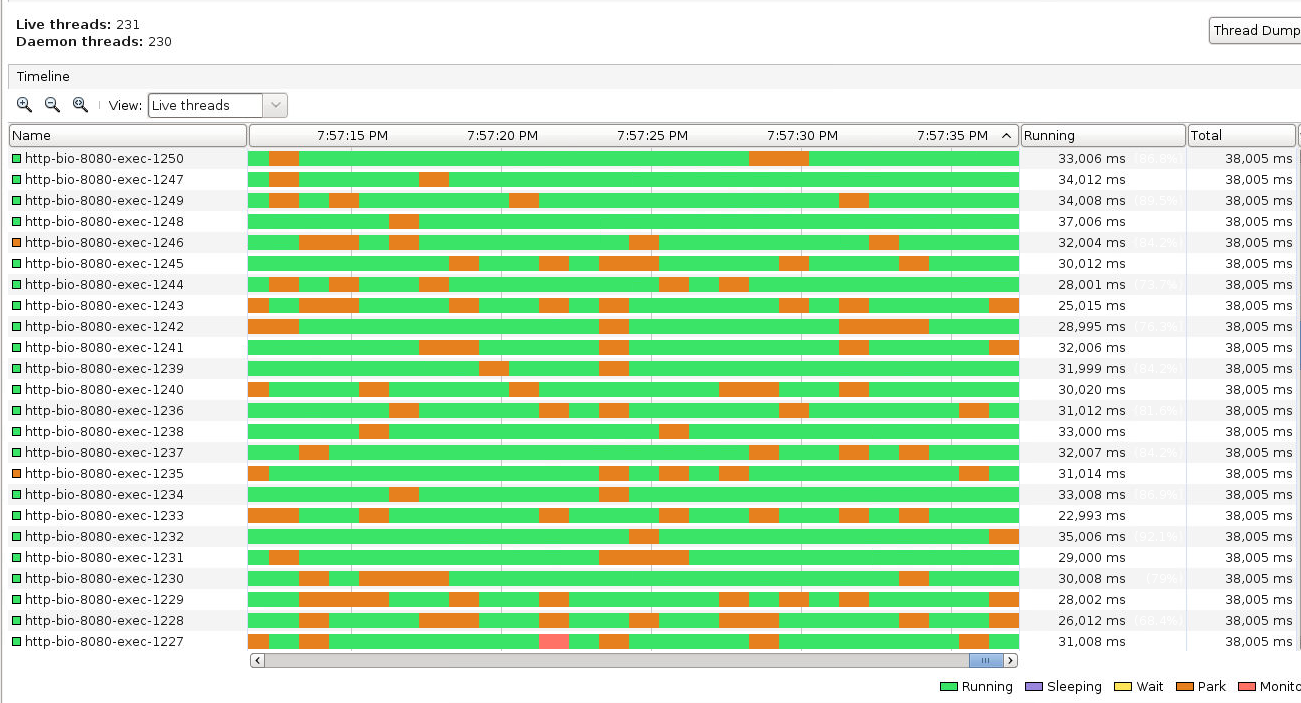
Check the server,we can see every work thread is busy
Case 2
maxThread: 500
| Client Thread | Average | Throughput | load average |
|---|---|---|---|
| 500 | 257 | 1935 | <3 |
| 1000 | 322 | 3086 | <3 |
| 1500 | 417 | 3458 | <3 |
| 2000 | 584 | 2815 | <3 |
| 3000 | 886 | 2487 | <3 |
Case 3
maxThread: 5000
| Client Thread | Average | Throughput | load average |
|---|---|---|---|
| 100 | 217 | 450 | <2 |
| 500 | 219 | 2240 | <2 |
| 1000 | 310 | 105 | <2 |
When the client over 1000,The Client Http tools appear many error logs,It shows "client Non HTTP response message: Read timed out",
check the tomcat log to get the error:
It shows The maxTheads number exceed the limiting Number of Processes Available,The CentOs max user processes default is 1024,update the param
at file /etc/security/limits.d/90-nproc.conf as following,
Case 4
continue the test,
maxThread: 5000
| Client Thread | Average | Throughput | load average |
|---|---|---|---|
| 500 | 198 | 2171 | <3 |
| 1000 | 199 | 4087 | <3 |
| 1500 | 211 | 5106 | <3 |
| 2000 | 220 | 5820 | <3 |
Case 5
1.update the JVM options
JAVA_OPTS="$JAVA_OPTS -Xms3g -Xmx5g -Xss512K -XX:PermSize=256m -XX:MaxPermSize=512m "
2.maxThread: 5000
| Client Thread | Average | Throughput | maxThreads | load average |
|---|---|---|---|---|
| 500 | 201 | 6926 | 5000 | 3.6 |
| 1000 | 220 | 8122 | 5000 | 4.02 |
| 1500 | 348 | 8238 | 5000 | 4.3 |
| 2000 | 446 | 7869 | 5000 | 8.2 |
Now,Check the JVM,
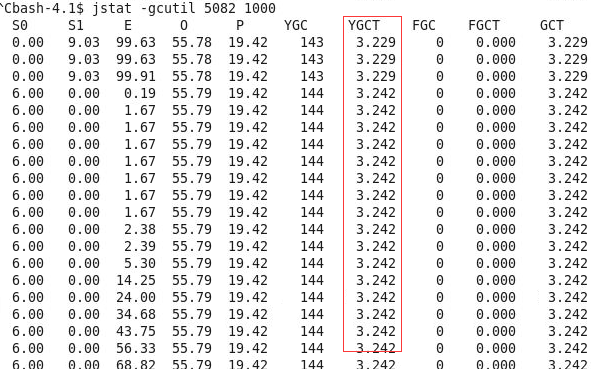
It seam there's enought Memory,and The GC frequency is not hight,So exclude the VM Memory factor, And As the case 5 shows,
Load is over the CPU max load,It have arrive the bottleneck of system.


 1049
1049


 被折叠的 条评论
为什么被折叠?
被折叠的 条评论
为什么被折叠?
 到【灌水乐园】发言


