


FusionCharts v3.2破解版下载
http://download.csdn.net/detail/e421083458/6708951
使用方法:
1.解压文件到网站当中。
2.在web上预览文件中的内容。
4.有版权信息没关系,从./Charts里肯定能找到你想要的破解的文件。
5.把图标导成图片格式。./Code/PHP/Export/Download.php,注意文件路径。
范例:
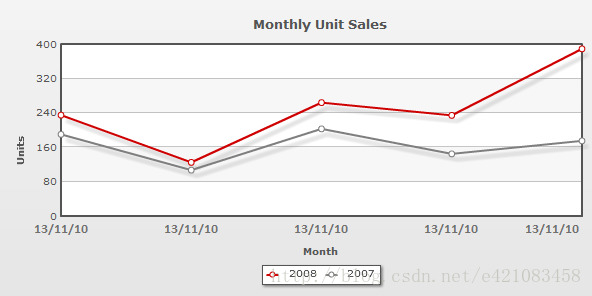
以下以一张图上显示多个曲线为例:
数据文件:
<chart animation="1" exportEnabled='1' exportAction='Download' exportAtClient='0' exportHandler='./ExportHandlers/PHP/FCExporter.php'
showlegend="1" showValues='0' themename="Custom"
caption='Monthly Unit Sales' xAxisName='Month' yAxisName='Units' showValues='0' formatNumberScale='0' showBorder='1'
>
<categories>
<category label="13/11/10"/>
<category label="13/11/10"/>
<category label="13/11/10"/>
<category label="13/11/10"/>
<category label="13/11/10"/>
</categories>
<dataset seriesName="2008" color_cc="CE0000" color="CE0000">
<set value="235"/>
<set value="125"/>
<set value="264"/>
<set value="234"/>
<set value="389"/>
</dataset>
<dataset seriesName="2007" color="7F7F7F" color_cc="7F7F7F">
<set value="190"/>
<set value="107"/>
<set value="203"/>
<set value="145"/>
<set value="175"/>
</dataset>
<styles><definition><style name="Font_0" type="font" font="Calibri" size="13" color="6F6F6F" bold="1" Italic="0" underline="0"  isHTML="0"/><style type="Shadow" name="Shadow_0" Distance="8" Color="8F8F8F" Alpha="50" blurY="5"/></definition><application><apply toObject="DATALABELS" styles="Font_0"/><apply toObject="DATAPLOT" styles="Shadow_0"/></application></styles></chart>
./ExportHandlers/PHP/FCExporter.php文件请参考文档。
主目录:
<!DOCTYPE html PUBLIC "-//W3C//DTD XHTML 1.0 Transitional//EN" "http://www.w3.org/TR/xhtml1/DTD/xhtml1-transitional.dtd">
<html>
<head>
<meta http-equiv="Content-Type" content="text/html; charset=utf-8" />
<title>Using FusionCharts Styles - shadow</title>
<script type="text/javascript" src="Charts/FusionCharts.js"></script>
<link href="Code/assets/ui/css/style.css" rel="stylesheet" type="text/css" />
<!--[if IE 6]>
<script>
<script type="text/javascript" src="../assets/ui/js/DD_belatedPNG_0.0.8a-min.js"></script>
/* select the element name, css selector, background etc */
DD_belatedPNG.fix('img');
/* string argument can be any CSS selector */
</script>
<![endif]-->
<style type="text/css">
h2.headline {
font: normal 110%/137.5% "Trebuchet MS", Arial, Helvetica, sans-serif;
padding: 0;
margin: 25px 0 25px 0;
color: #7d7c8b;
text-align: center;
}
p.small {
font: normal 68.75%/150% Verdana, Geneva, sans-serif;
color: #919191;
padding: 0;
margin: 0 auto;
width: 664px;
text-align: center;
}
</style>
<script type="text/javascript">
// this function exports chart from JavaScript
function exportChart(exportFormat)
{
// checks if exportChart function is present and call exportChart function
if ( FusionCharts("myChartId").exportChart )
FusionCharts("myChartId").exportChart( { "exportFormat" : exportFormat } );
else
alert ( "Please wait till the chart completes rendering..." );
}
</script>
</head>
<body>
<div id="wrapper">
<div id="header">
<div class="logo"><a class="imagelink" href="index.html"><img src="Code/assets/ui/images/fusionchartsv3.2-logo.png" width="131" height="75" alt="FusionCharts v3.2 logo" /></a></div>
<h1 class="brand-name">FusionCharts</h1>
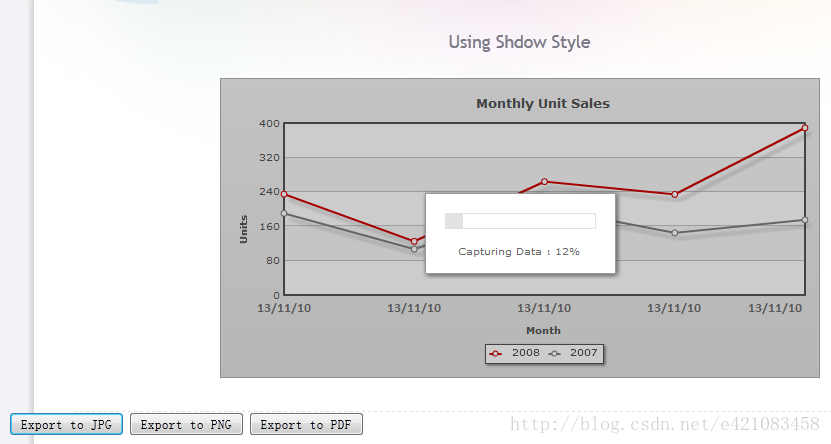
<h1 class="logo-text">Using Shdow Style</h1>
</div>
<div class="content-area">
<div id="content-area-inner-main">
<h2 class="headline">Using Shdow Style</h2>
<div class="gen-chart-render">
<div id="chartContainer">FusionCharts will load here</div>
<script type="text/javascript"><!--
var myChart = new FusionCharts( "Charts/MSLine.swf", "myChartId", "600", "300", "0", "1" );
myChart.setXMLUrl( "shadow.xml" );
myChart.render( "chartContainer" );
// -->
</script>
</div>
<div class="clear"></div>
<p> </p>
<p class="small"> </p>
<div class="underline-dull"></div>
</div>
</div>
<input value="Export to JPG" type="button" onClick="JavaScript:exportChart('JPG')" />
<input value="Export to PNG" type="button" onClick="JavaScript:exportChart('PNG')" />
<input value="Export to PDF" type="button" onClick="JavaScript:exportChart('PDF')" />
<div id="footer">
<ul>
<li><a href="../index.html"><span>« Back to list of examples</span></a></li>
<li class="pipe">|</li>
<li><a href="../NoChart.html"><span>Unable to see the chart above?</span></a></li>
</ul>
</div>
</div>
</body>
</html>测试效果:


 2325
2325


 被折叠的 条评论
为什么被折叠?
被折叠的 条评论
为什么被折叠?
 到【灌水乐园】发言


