


前言
使用Python开发一个股票项目。
项目地址:
https://github.com/pythonstock/stock
相关资料:
http://blog.csdn.net/freewebsys/article/details/78294566
主要使用开发语言是python。
使用的lib库是pandas,tushare,TensorFlow,tornado等。
本文的原文连接是: http://blog.csdn.net/freewebsys/article/details/78634996
未经博主允许不得转载。
博主地址是:http://blog.csdn.net/freewebsys
1,关于bokeh
bokeh 是一个超级方便的python画图工具。
但是想把这个东西集成到我的股票统计系统上面。
有一个问题。官方的demo给的是直接输出到html文件当中。
而和 tornado 集成上面也是一个封装。都不是我想要的方法。
直接找到 bokeh的源代码读了下,找到了方法。
2,分析
https://bokeh.pydata.org/en/latest/docs/user_guide/server.html
这个类很好的说明了下
https://github.com/bokeh/bokeh/blob/master/examples/embed/embed_themed.py
from bokeh.embed import components
script, div = components(p1, theme=theme)
返回的是script 和 div 最关键的两个
一个简单的两个图形:
#!/usr/bin/python3
# -*- coding: utf-8 -*-

from tornado import gen
import web.base as webBase
import logging

# 首映 bokeh 画图。
from bokeh.plotting import figure
from bokeh.embed import components


# 获得页面数据。
class GetDataIndicatorsHandler(webBase.BaseHandler):
    @gen.coroutine
    def get(self):
        code = self.get_argument("code", default=None, strip=False)
        print(code)
        # self.uri_ = ("self.request.url:", self.request.uri)
        # print self.uri_
        try:
            print("#######")
        except Exception as e:
            print("error :", e)
        logging.info("####################GetStockHtmlHandlerEnd")

        comp_list = []
        # prepare some data
        x = [1, 2, 3, 4, 5]
        y = [6, 7, 2, 4, 5]

        # create a new plot with a title and axis labels
        p = figure(
            plot_width=400, plot_height=300,
            title="simple line example",
            x_axis_label='x', y_axis_label='y'
        )

        # add a line renderer with legend and line thickness
        p.line(x, y, legend="Temp.", line_width=2)

        comp1 = components(p)
        comp2 = components(p)
        comp_list.append(comp1)
        comp_list.append(comp2)

        self.render("stock_indicators.html", comp_list=comp_list)
页面显示:
<!-- 增加 bokeh 样式。-->
<link rel="stylesheet" href="/static/css/bokeh.min.css" type="text/css"/>
<link rel="stylesheet" href="/static/css/bokeh-widgets.min.css" type="text/css"/>
<link rel="stylesheet" href="/static/css/bokeh-tables.min.css" type="text/css"/>

<script type="text/javascript" src="/static/js/bokeh.min.js"></script>
<script type="text/javascript" src="/static/js/bokeh-widgets.min.js"></script>
<script type="text/javascript" src="/static/js/bokeh-tables.min.js"></script>
<script type="text/javascript" src="/static/js/bokeh-gl.min.js"></script>
<script type="text/javascript">
    Bokeh.set_log_level("info");

</script>


<h3 class="header smaller lighter blue">数据详细展示</h3>
<div class="table-header">1.</div>

    {% for index,element in enumerate(comp_list) %}
            <div class="row" id="_col_{{ index+1 }}" data-column="{{ index }}">
                {% raw element[0] %}
                {% raw element[1] %}
            </div>
    {% end %}
其中 这些资源在的地址是:
/usr/local/lib/python3.5/dist-packages/bokeh/server
这个在安装之后才能有。
3,显示效果
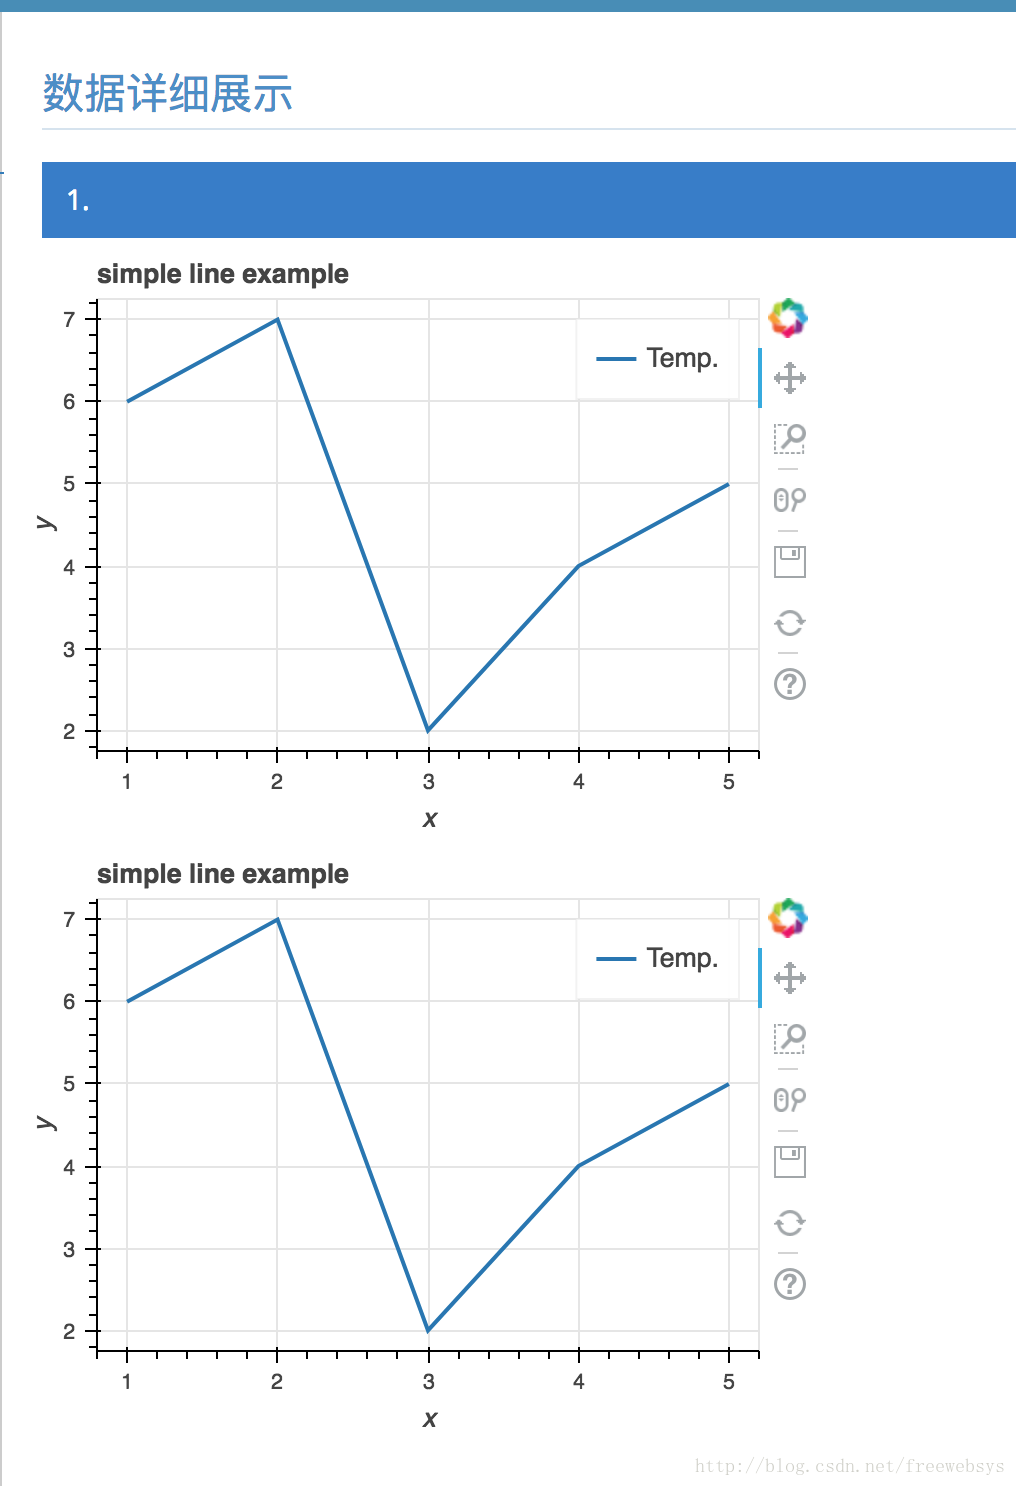
直接在一个页面当中显示两个图片。可以展示多个股票分析数据
4,总结
bokeh 是一个非常方便的库,我在开发股票系统的时候,需要展示多个分析的报表。这个时候就需要并列的显示多个图表。
类库使用的非常方便。
本文的原文连接是: http://blog.csdn.net/freewebsys/article/details/78634996
未经博主允许不得转载。
博主地址是:http://blog.csdn.net/freewebsys
https://bokeh.pydata.org/en/latest/docs/user_guide/quickstart.html


 1177
1177


 被折叠的 条评论
为什么被折叠?
被折叠的 条评论
为什么被折叠?
 到【灌水乐园】发言


