


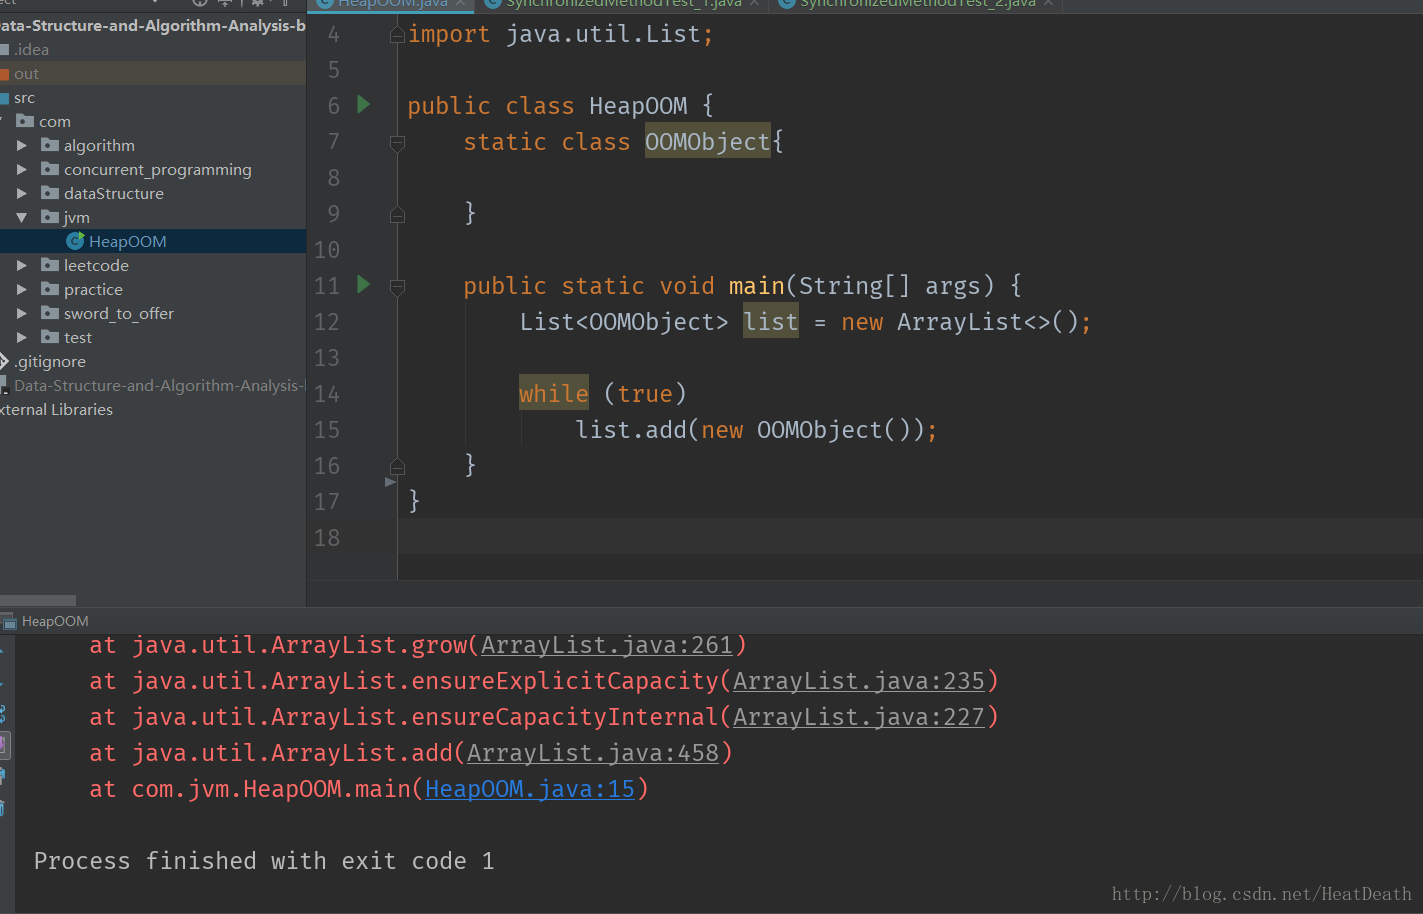
0 创建Test项目,新建Test类,创建main方法
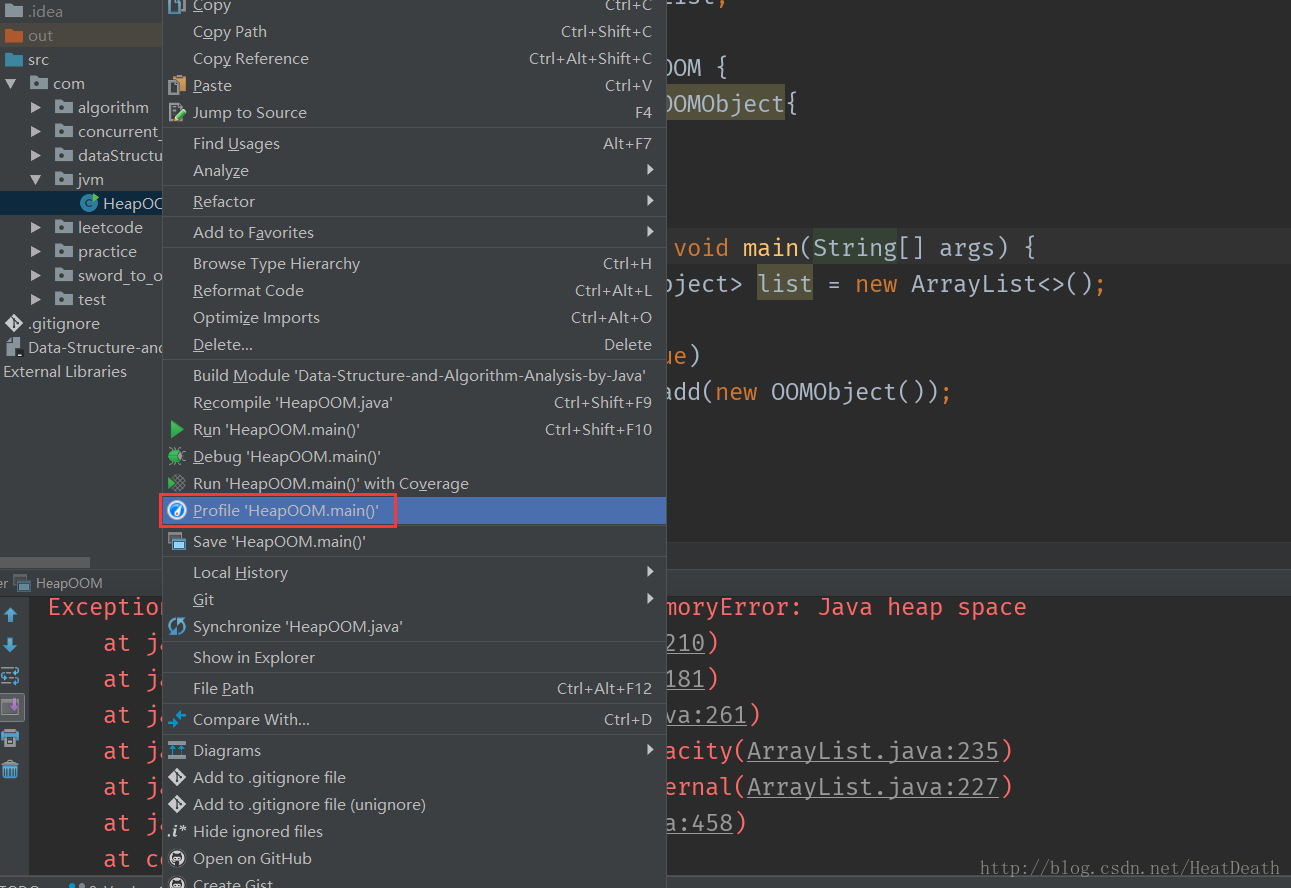
1 选中Class, profiler ‘test.main’,第一次运行设置profiler安装目录
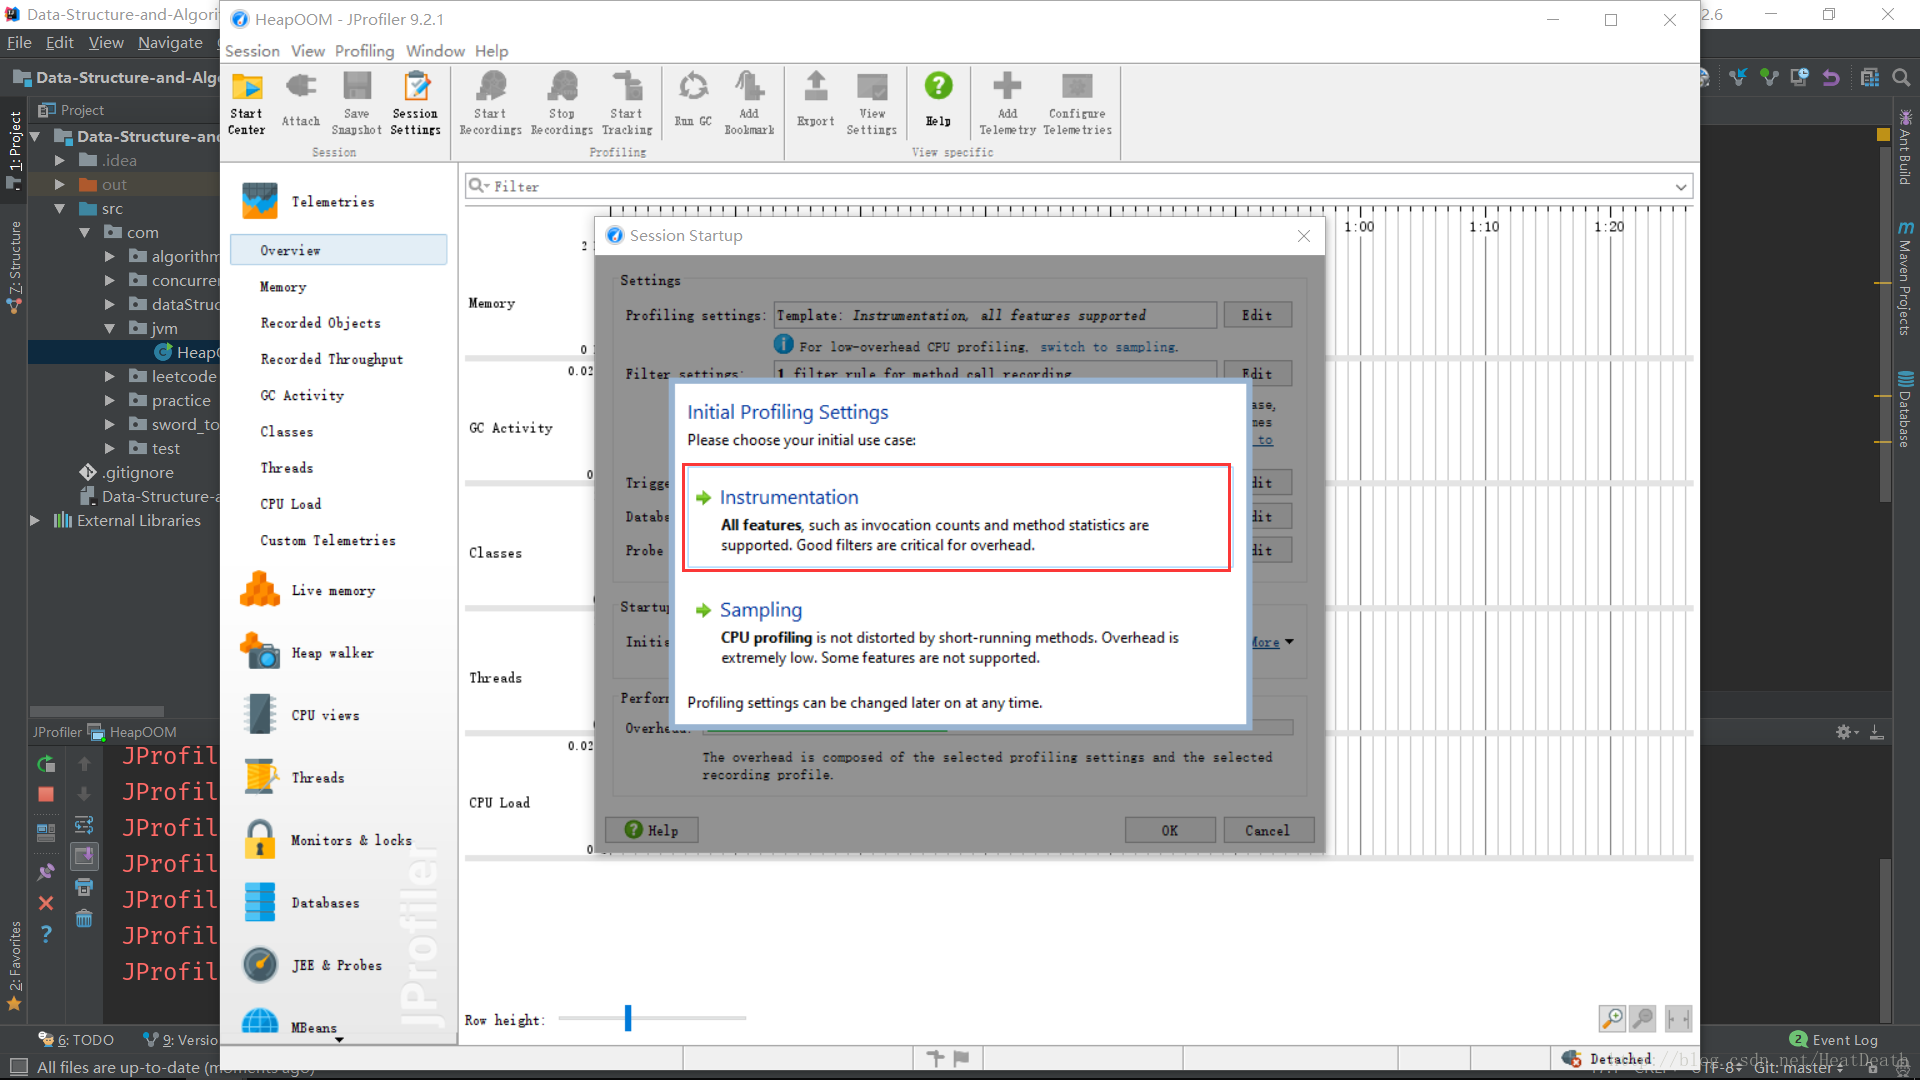
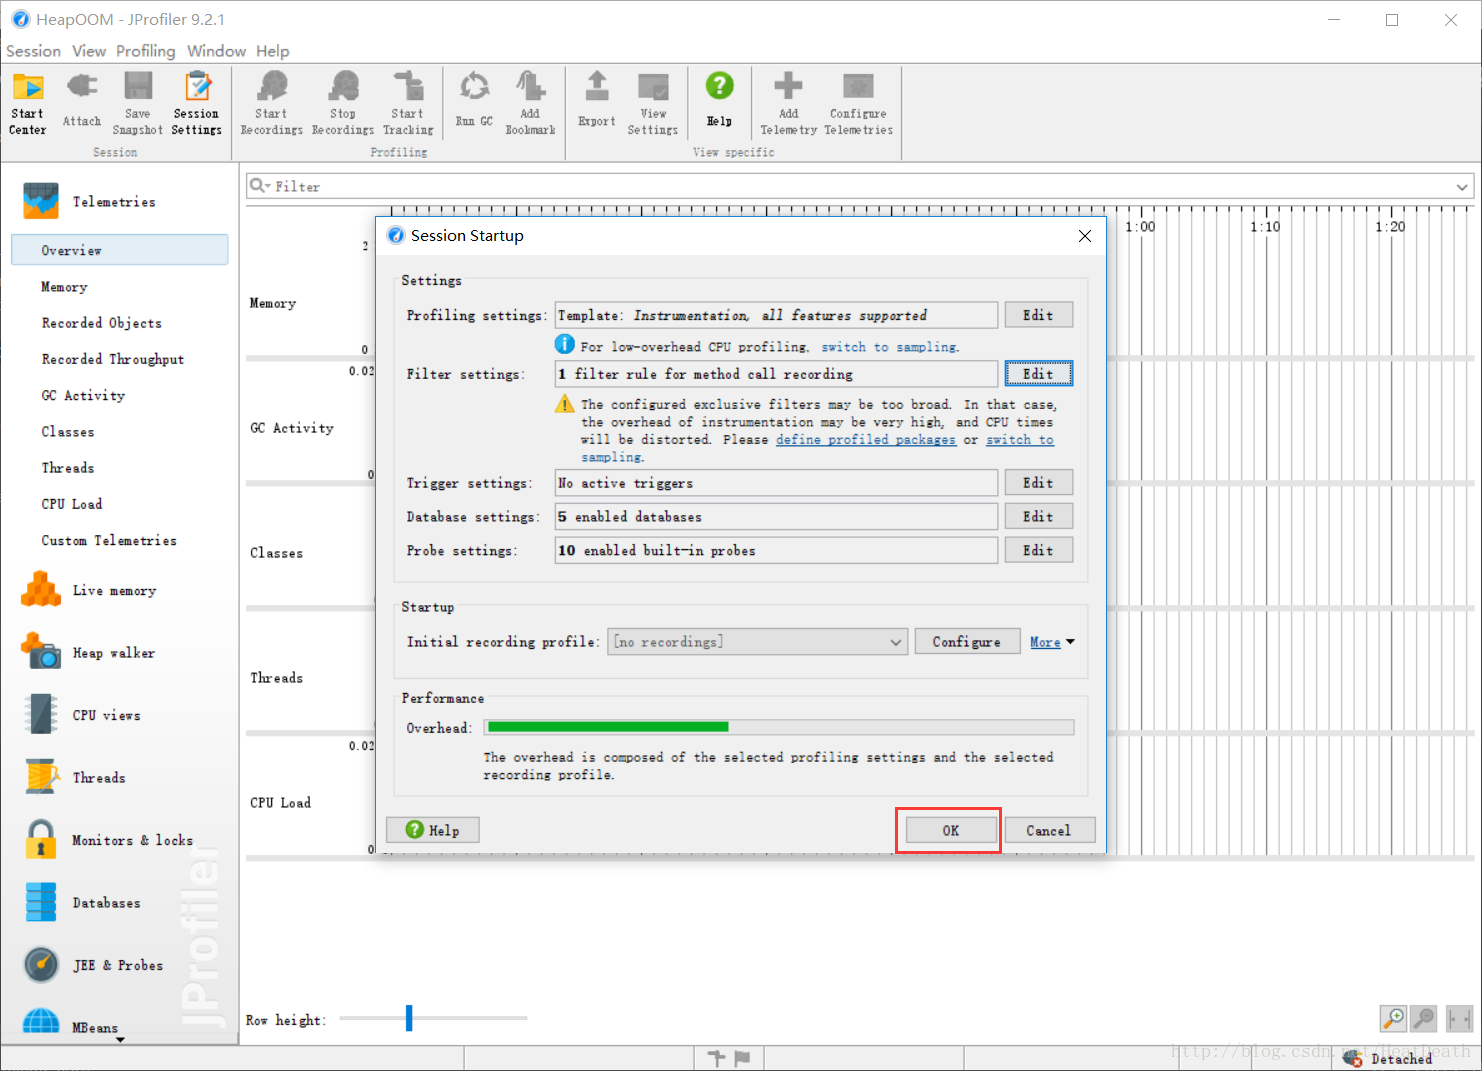
2 运行后,选择Instrumentation,可以查看详细的信息
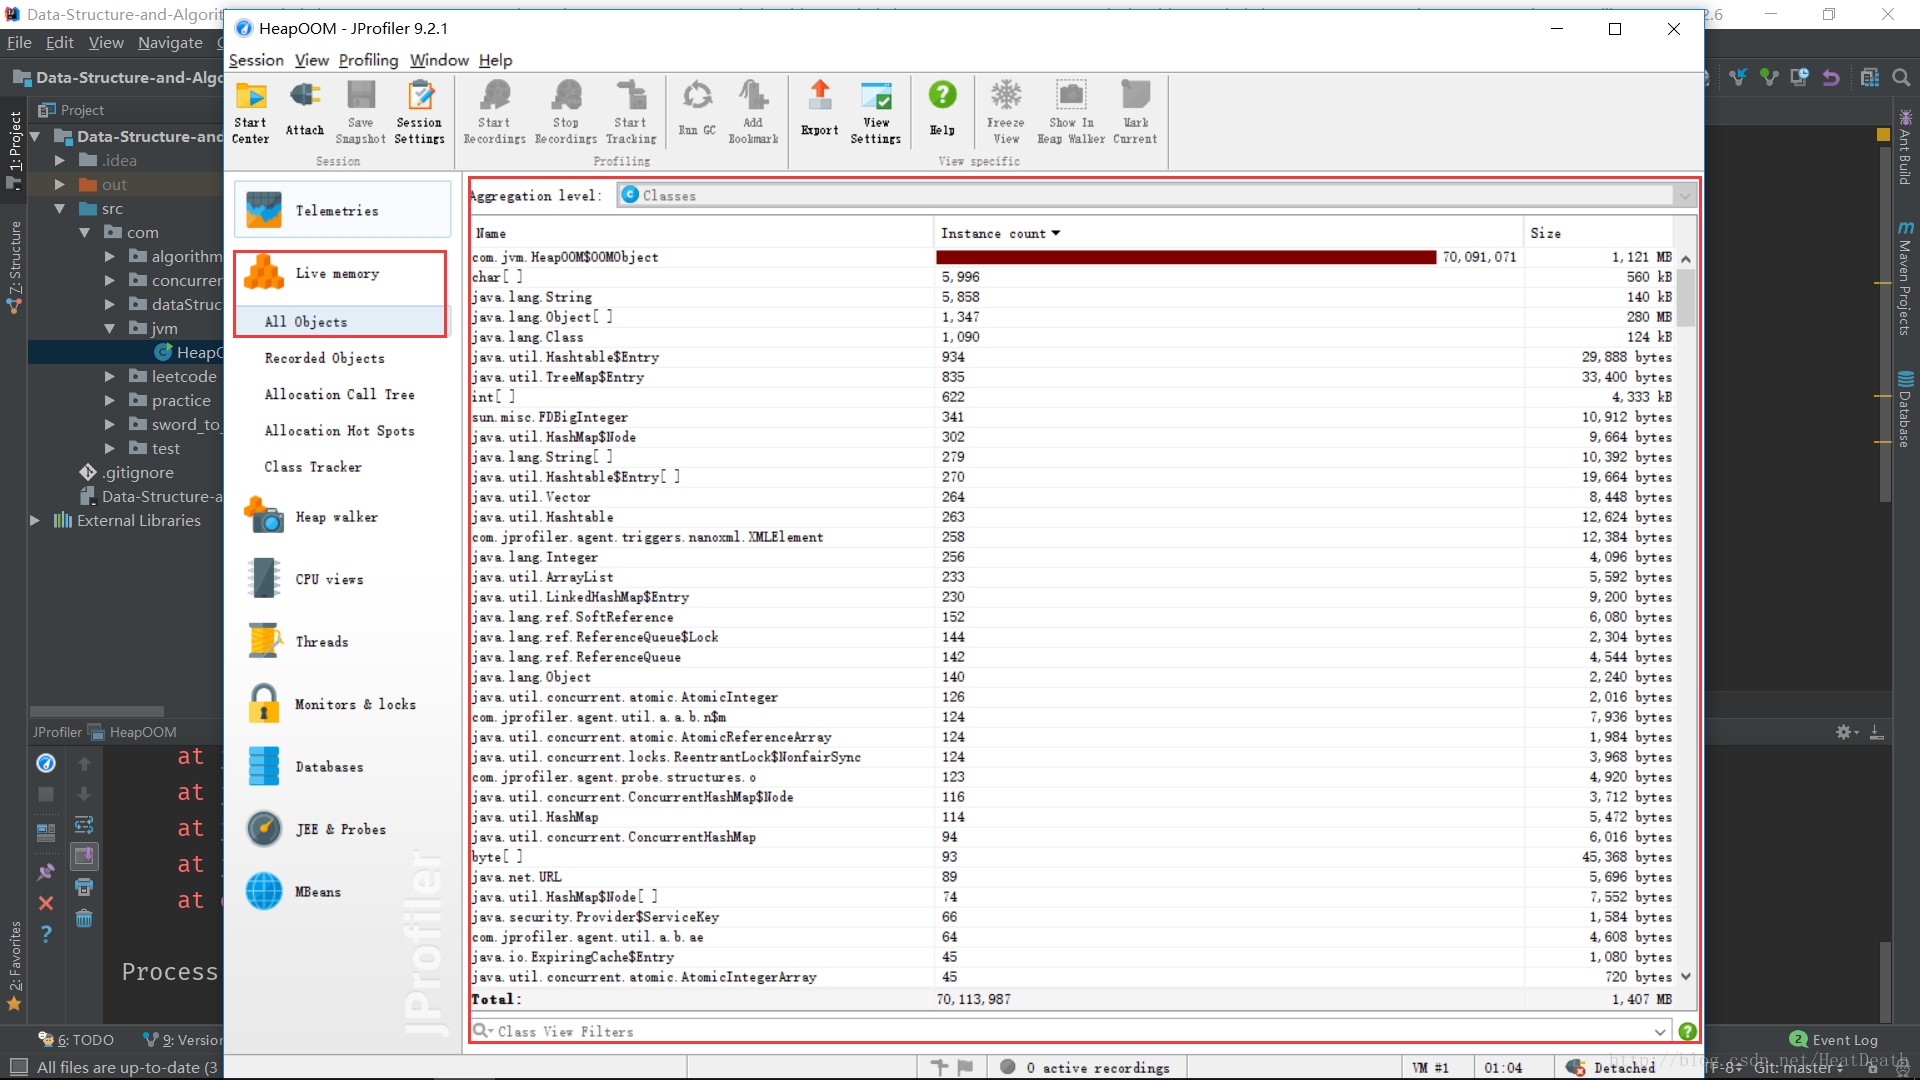
3 查看运行中的main方法内存占用情况,选中Live memory->All Objects
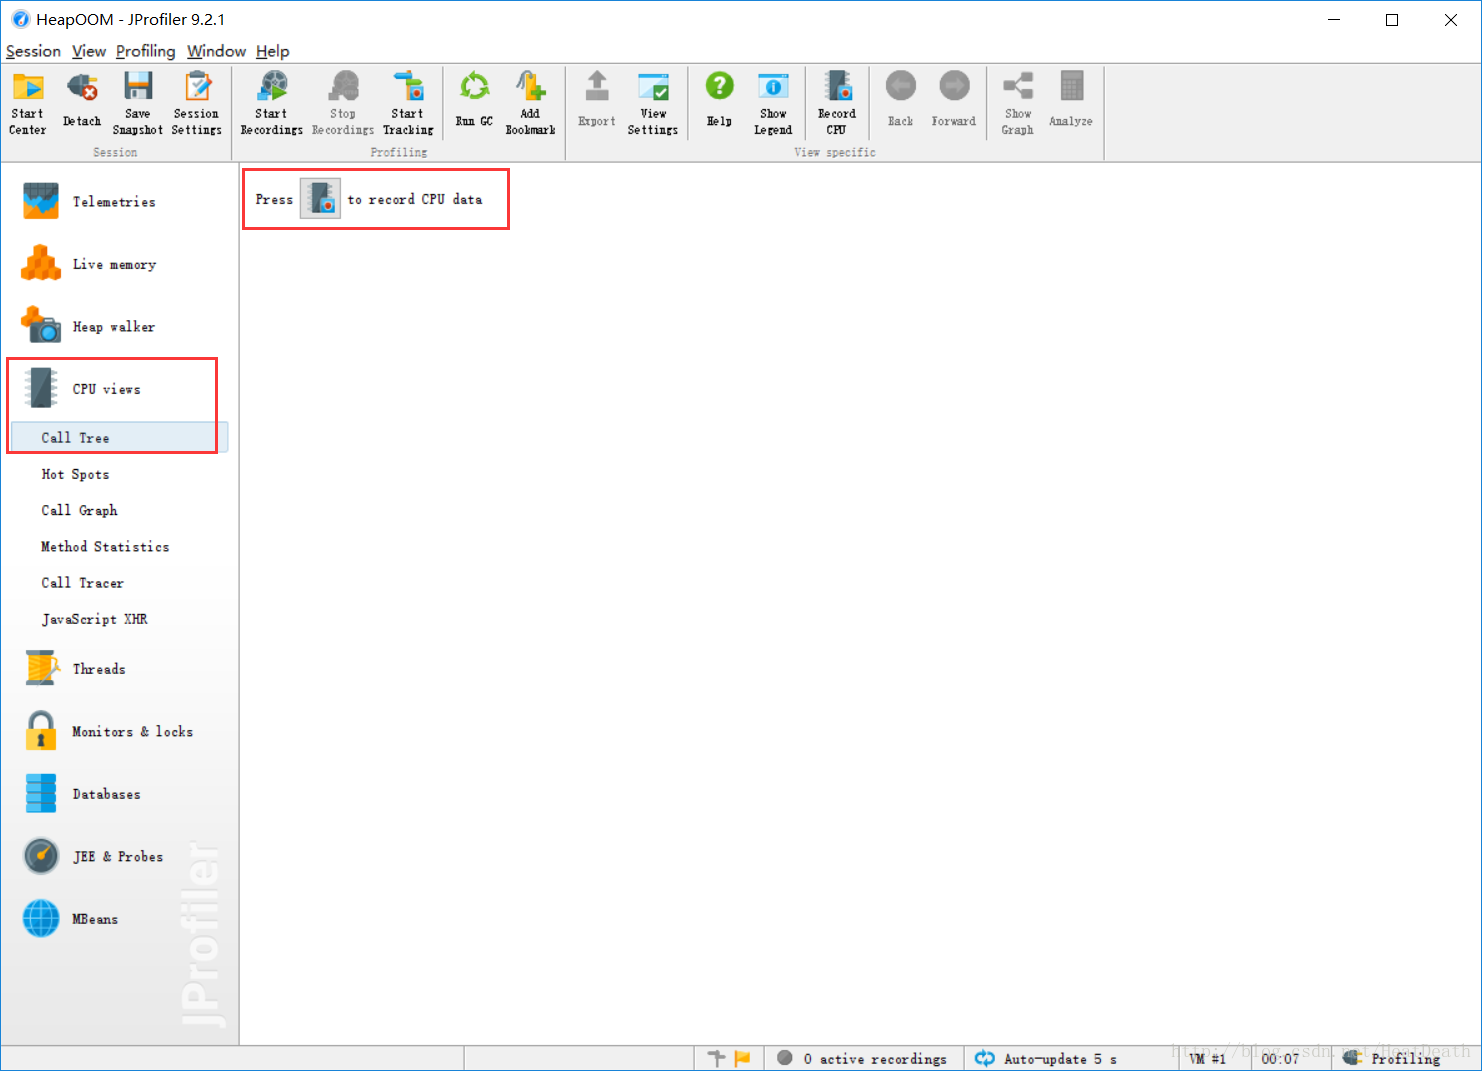
4 查看CPU占用情况,选中CPU views->Hot Spots点击按钮
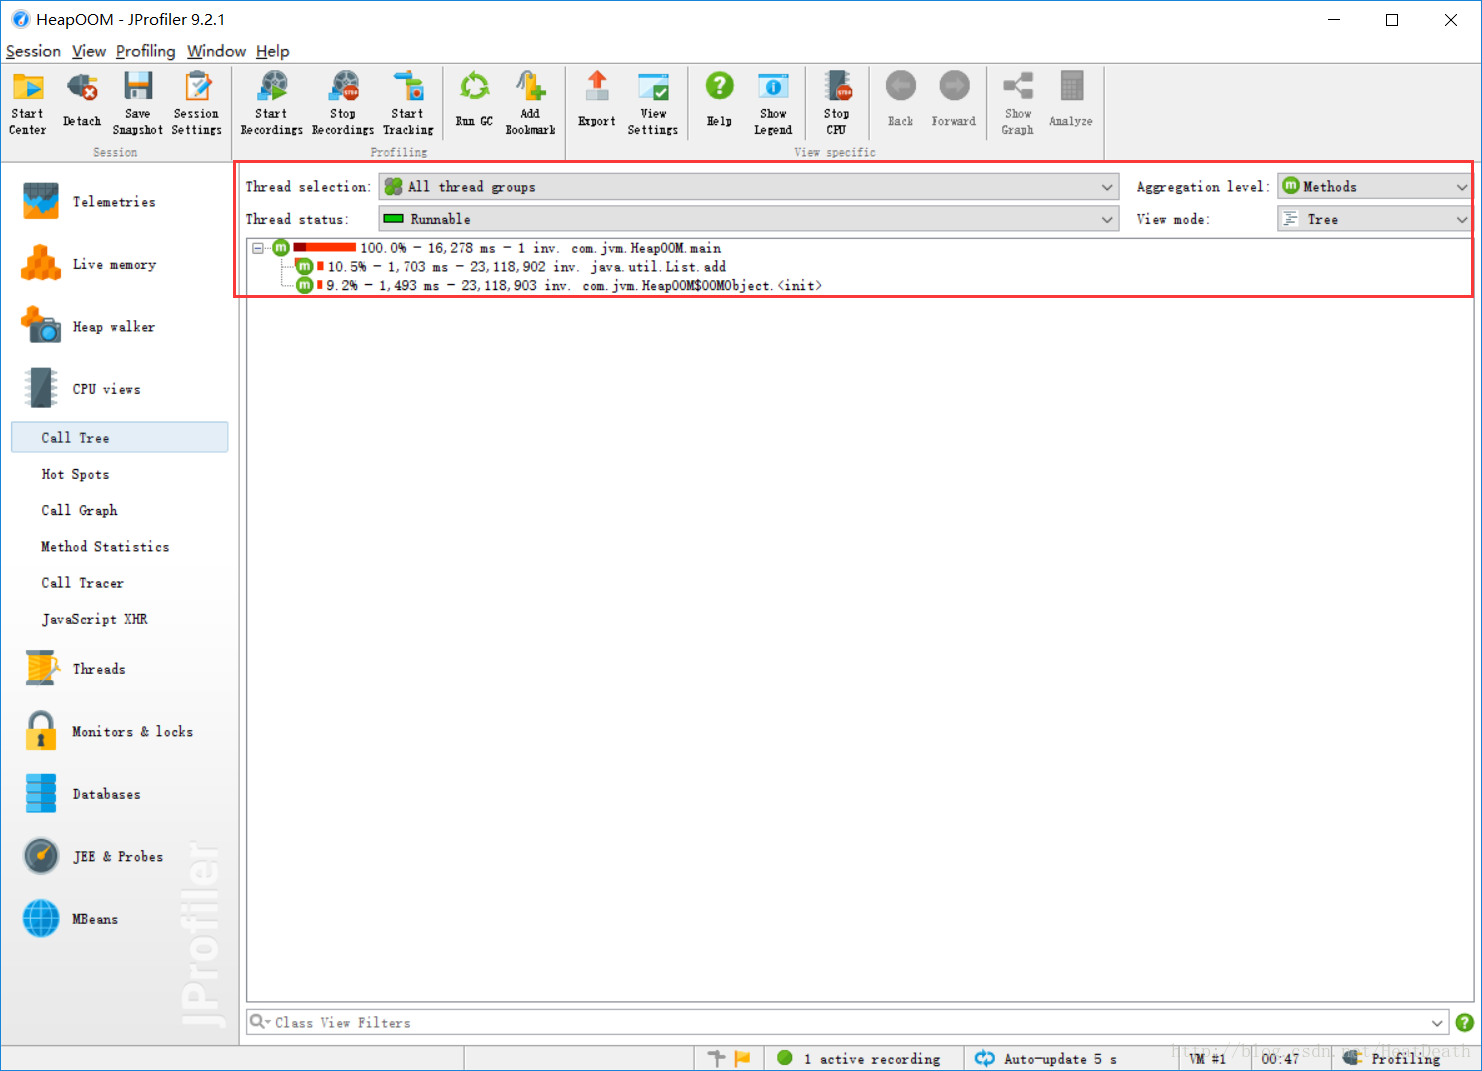
5 运行中的main方法CPU占用情况
JProfiler集成IDEA查看Java项目性能(二)
http://huangdongrong.github.io/2016/05/18/jprofiler-use/


 334
334


 被折叠的 条评论
为什么被折叠?
被折叠的 条评论
为什么被折叠?
 到【灌水乐园】发言


