


 本文详细介绍MPChart库中条形图的使用方法与实践案例。通过具体代码演示了如何在Android应用中集成并定制化BarChart条形图,包括布局配置、数据加载及动画效果等。
最牛逼android上的图表库MpChart(三) 条形图
最近工作中,用到了mpchart图表库,现在分享受下mpchart图表库的各个图表在实际工作应用场景:
- 最牛逼android上的图表库MpChart(一) 介绍篇
- 最牛逼android上的图表库 MpChart(二) 折线图
- 最牛逼android上的图表库MpChart(三) 条形图
- 最牛逼android上的图表库MpChart(四) 饼图
- 最牛逼android上的图表库MpChart(五) 泡泡图
附上mpandroidchartlibrary-2-1-6.jar的下载链接:http://download.csdn.net/detail/hejjunlin/9561829
使用mpchart jar包:mpandroidchartlibrary-2-1-6.jar
如果是在studio下,进行如下引用:
repositories {
maven { url “https://jitpack.io” }
}
dependencies {
compile ‘com.github.PhilJay:MPAndroidChart:v2.1.6’
}
BarChart条形图介绍
- BarChart类
- 使用哪些API
BarChart条形图实例
- 布局文件
- Java代码
<?xml version="1.0" encoding="utf-8"?>
<RelativeLayout xmlns:android="http://schemas.android.com/apk/res/android"
    android:layout_width="match_parent"
    android:layout_height="match_parent" >

    <com.github.mikephil.charting.charts.BarChart
        android:id="@+id/chart1"
        android:layout_width="match_parent"
        android:layout_height="match_parent" />

</RelativeLayout>
package com.example.mpchart;
import java.util.ArrayList;
import java.util.List;
import android.annotation.SuppressLint;
import android.app.Activity;
import android.graphics.Color;
import android.graphics.PointF;
import android.graphics.RectF;
import android.graphics.Typeface;
import android.os.Bundle;
import android.os.Handler;
import android.os.Looper;
import android.os.Message;
import android.util.Log;
import android.view.WindowManager;
import com.example.mpchart.data.ErrorCodePercentDataSource;
import com.example.mpchart.data.IDataSource;
import com.example.mpchart.data.IDataSource.onDataChangedListener;
import com.example.mpchart.utils.DBHelper;
import com.example.mpchart.utils.DateUtils;
import com.example.mpchart.utils.LogUtils;
import com.github.mikephil.charting.charts.BarChart;
import com.github.mikephil.charting.components.Legend;
import com.github.mikephil.charting.components.Legend.LegendDirection;
import com.github.mikephil.charting.components.Legend.LegendForm;
import com.github.mikephil.charting.components.Legend.LegendPosition;
import com.github.mikephil.charting.components.XAxis;
import com.github.mikephil.charting.components.XAxis.XAxisPosition;
import com.github.mikephil.charting.components.YAxis;
import com.github.mikephil.charting.components.YAxis.AxisDependency;
import com.github.mikephil.charting.components.YAxis.YAxisLabelPosition;
import com.github.mikephil.charting.data.BarData;
import com.github.mikephil.charting.data.BarDataSet;
import com.github.mikephil.charting.data.BarEntry;
import com.github.mikephil.charting.data.Entry;
import com.github.mikephil.charting.formatter.YAxisValueFormatter;
import com.github.mikephil.charting.highlight.Highlight;
import com.github.mikephil.charting.listener.OnChartValueSelectedListener;
import com.github.mikephil.charting.utils.ColorTemplate;
public class BarChartActivity extends Activity implements OnChartValueSelectedListener {
private static final String TAG = "BarChartActivity";
protected BarChart mChart;
private IDataSource mDataSource = new ErrorCodePercentDataSource();
private String mDateTime;
private Typeface mTf;
private Handler mHandler = new Handler(Looper.getMainLooper()) {
@Override
public void handleMessage(Message msg) {
super.handleMessage(msg);
getData();
}
};
@Override
protected void onCreate(Bundle savedInstanceState) {
super.onCreate(savedInstanceState);
getWindow().setFlags(WindowManager.LayoutParams.FLAG_FULLSCREEN, WindowManager.LayoutParams.FLAG_FULLSCREEN);
setContentView(R.layout.activity_barchart);
mChart = (BarChart) findViewById(R.id.chart1);
mChart.setOnChartValueSelectedListener(this);
mChart.setDescription(""/*mDataSource.getDescription()*/);
mChart.setDescriptionTextSize(30);
// mChart.setDescriptionPosition(960, 550);
mChart.setDrawBarShadow(false);
mChart.setDrawValueAboveBar(true);
// if more than 60 entries are displayed in the chart, no values will be
// drawn
mChart.setMaxVisibleValueCount(60);
// scaling can now only be done on x- and y-axis separately
mChart.setPinchZoom(false);
mChart.setDrawGridBackground(false);
// mChart.setDrawYLabels(false);
mTf = Typeface.createFromAsset(getAssets(), "OpenSans-Regular.ttf");
XAxis xAxis = mChart.getXAxis();
xAxis.setPosition(XAxisPosition.BOTTOM);
xAxis.setTypeface(mTf);
xAxis.setDrawGridLines(false);
xAxis.setSpaceBetweenLabels(2);
YAxisValueFormatter custom = new MyYAxisValueFormatter();//设置Y轴上的显示单位
YAxis leftAxis = mChart.getAxisLeft();
leftAxis.setTypeface(mTf);
leftAxis.setLabelCount(8, false);
leftAxis.setValueFormatter(custom);
leftAxis.setPosition(YAxisLabelPosition.OUTSIDE_CHART);
leftAxis.setSpaceTop(15f);
leftAxis.setAxisMinValue(0f); // this replaces setStartAtZero(true)
YAxis rightAxis = mChart.getAxisRight();
rightAxis.setDrawGridLines(false);
rightAxis.setTypeface(mTf);
rightAxis.setLabelCount(8, false);
rightAxis.setValueFormatter(custom);
rightAxis.setSpaceTop(15f);
rightAxis.setAxisMinValue(0f); // this replaces setStartAtZero(true)
Legend l = mChart.getLegend();
l.setPosition(LegendPosition.BELOW_CHART_LEFT);
l.setForm(LegendForm.SQUARE);
l.setFormSize(9f);
l.setTextSize(11f);
l.setXEntrySpace(4f);
getData();
new Thread(mRunnable).start();
// mChart.setDrawLegend(false);
}
private Runnable mRunnable = new Runnable() {
@Override
public void run() {
while(true) {
try {
Thread.sleep(15*1000);//15s刷新下数据
mHandler.sendMessage(mHandler.obtainMessage());
} catch (InterruptedException e) {
e.printStackTrace();
}
}
}
};
private onDataChangedListener listener = new onDataChangedListener() {
@Override
public void onChanged(String[] xx, String[] yy) {
notifyDataChanged(xx, yy);
}
};
private void getData() {
LogUtils.d(TAG, "getData() " + DateUtils.getCurrentDate());
new Thread(new Runnable() {
@Override
public void run() {
DBHelper.getInstance().init();
String table = "error_info_" + DateUtils.get2HoursDate();
String sql = "select *from " + table + " limit 20"/* + DateUtils.get2HoursDate()*/;
boolean isexist = DBHelper.getInstance().isTableExist(table);
if (isexist) {
mDateTime = DateUtils.get2HoursDate();
final String[] xx = DBHelper.getInstance().query(sql,3);
final String[] yy = DBHelper.getInstance().query(sql,5);
mHandler.post(new Runnable() {
@Override
public void run() {
listener.onChanged(xx, yy);
}
});
} else {
String table2 = "error_info_" + DateUtils.getOneHoursAgoTime();
mDateTime = DateUtils.getOneHoursAgoTime();
String sql2 = "select *from " + table2 + " limit 20";
LogUtils.d(TAG, "getData() sql2 " + sql2);
final String[] xx = DBHelper.getInstance().query(sql2,3);
final String[] yy = DBHelper.getInstance().query(sql2,5);
mHandler.post(new Runnable() {
@Override
public void run() {
listener.onChanged(xx, yy);
}
});
}
}
}).start();
}
private void notifyDataChanged(String[] xx, String[] yy) {
Typeface tf = Typeface.createFromAsset(getAssets(),"OpenSans-Regular.ttf");
// 加载数据
setData(xx,yy );
//从X轴进入的动画
mChart.animateX(2000);
// mChart.animateY(2000); //从Y轴进入的动画
// mChart.animateXY(2000, 2000); //从XY轴一起进入的动画
//设置最小的缩放
mChart.setScaleMinima(0.5f, 1f);
//设置视口
// mChart.centerViewPort(10, 50);
// get the legend (only possible after setting data)
Legend l = mChart.getLegend();
l.setForm(LegendForm.LINE); //设置图最下面显示的类型
l.setTypeface(tf);
l.setTextSize(30);
l.setTextColor(Color.rgb(244, 117, 117));
l.setDirection(LegendDirection.LEFT_TO_RIGHT);
l.setYOffset(660);
l.setFormSize(20f); // set the size of the legend forms/shapes
// 刷新图表
mChart.invalidate();
}
private void setData(String[] xx, String[] yy) {
ArrayList<String> xVals = new ArrayList<String>();
for (int i = 0; i < xx.length; i++) {
xVals.add(xx[i]);
}
ArrayList<BarEntry> yVals1 = new ArrayList<BarEntry>();
for (int i = 0; i < yy.length; i++) {
float y = Float.parseFloat(yy[i]);
yVals1.add(new BarEntry(y, i));//填充数据
}
BarDataSet set1;
mChart.animateY(2000);//设置动画
set1 = new BarDataSet(yVals1, "DataSet");
set1.setBarSpacePercent(35f);
set1.setColors(ColorTemplate.LIBERTY_COLORS);
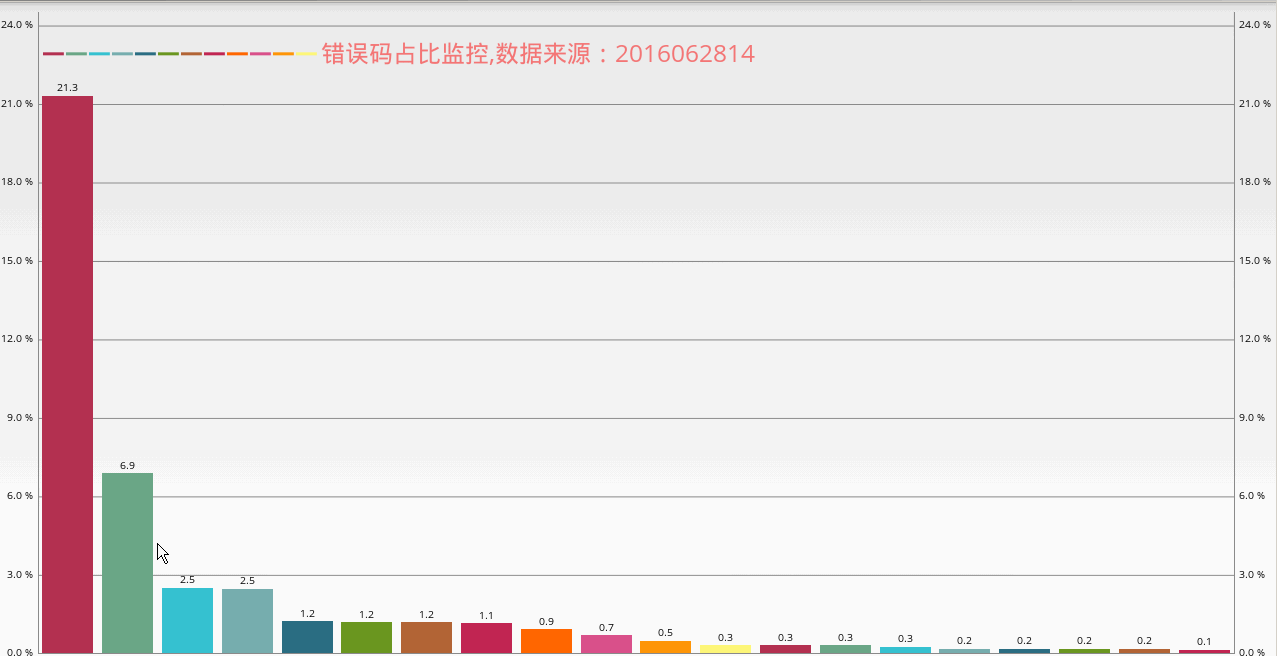
BarDataSet dataSets = new BarDataSet(yVals1, "错误码占比监控,数据来源: + mDateTime);
List<Integer> list = new ArrayList<Integer>();
list.add(Color.rgb(179, 48, 80));//设置颜色
list.add(Color.rgb(106, 167, 134));
list.add(Color.rgb(53, 194, 209));
list.add(Color.rgb(118, 174, 175));
list.add(Color.rgb(42, 109, 130));
list.add(Color.rgb(106, 150, 31));
list.add(Color.rgb(179, 100, 53));
list.add(Color.rgb(193, 37, 82));
list.add(Color.rgb(255, 102, 0));
list.add(Color.rgb(217, 80, 138));
list.add(Color.rgb(254, 149, 7));
list.add(Color.rgb(254, 247, 120));
dataSets.setColors(list);
BarData data = new BarData(xVals, dataSets);
data.setValueTextSize(10f);
data.setValueTypeface(mTf);
mChart.setData(data);
}
@SuppressLint("NewApi")
@Override
public void onValueSelected(Entry e, int dataSetIndex, Highlight h) {
if (e == null)
return;
RectF bounds = mChart.getBarBounds((BarEntry) e);
PointF position = mChart.getPosition(e, AxisDependency.LEFT);
Log.i("bounds", bounds.toString());
Log.i("position", position.toString());
Log.i("x-index",
"low: " + mChart.getLowestVisibleXIndex() + ", high: "
+ mChart.getHighestVisibleXIndex());
}
public void onNothingSelected() {
};
}


 840
840

 被折叠的 条评论
为什么被折叠?
被折叠的 条评论
为什么被折叠?
 到【灌水乐园】发言


