


LeakCanary是andrid 检测内存泄漏的工具,使用起来比MAT方便很多
下面介绍LeakCanary 的使用
下面是在在androidStudio 中使用
首先 在 build.gradle 中加入引用,不同的编译使用不同的引用:
dependencies {
    debugCompile 'com.squareup.leakcanary:leakcanary-android:1.3.1' // or 1.4-beta1
    releaseCompile 'com.squareup.leakcanary:leakcanary-android-no-op:1.3.1' // or 1.4-beta1
    testCompile 'com.squareup.leakcanary:leakcanary-android-no-op:1.3.1' // or 1.4-beta1
}
在Application 中使用,用于检测所有Activity的内存泄漏状况,只需要在Application onCreate()方法中添加LeakCanary.install(this); 一行代码就ok了
public class MyApplication extends Application{

    public static RefWatcher getRefWatcher(Context context) {

    @Override
    public void onCreate() {
        super.onCreate();
        LeakCanary.install(this);
    }
}还可以检测那些本该被回收的对象,使用RefWatcher
RefWatcher 用于:
1. 检测调用 Activity.onDestroy() 之后泄露的 activity
2. 检测 Fragment
检测调用 Activity.onDestroy() 之后泄露的 activity
LeakCanary.install() 会返回一个预定义的 RefWatcher,同时也会启用一个 ActivityRefWatcher,用于自动监控调用 Activity.onDestroy() 之后泄露的 activity。
public class MyApplication extends Application{

    public static RefWatcher getRefWatcher(Context context) {
        MyApplication application = (MyApplication) context.getApplicationContext();
        return application.refWatcher;
    }

    private RefWatcher refWatcher;


    @Override
    public void onCreate() {
        super.onCreate();
        refWatcher = LeakCanary.install(this);
    }
}
使用 RefWatcher 监控 Fragment
因为它和Activity实例一样可能持有大量的视图以及视图需要的资源(比如Bitmap)即在Fragment onDestroy方法中加入如下实现,使用refWatcher.watch(Object o)监控Fragmeng对象
public abstract class BaseFragment extends Fragment {

    @Override public void onDestroy() {
        super.onDestroy();
        RefWatcher refWatcher = MyApplication.getRefWatcher(getActivity());
        refWatcher.watch(this);
    }
}
模拟内存泄漏
public class TestDataModel {

    private static TestDataModel sInstance;
    private TextView mRetainedTextView;

    public static TestDataModel getInstance() {
        if (sInstance == null) {
            sInstance = new TestDataModel();
        }
        return sInstance;
    }

    public void setRetainedTextView(TextView textView) {
        mRetainedTextView = textView;
    }
}
然后在Activity 和 Fragment 中分别调用
TextView textview = (TextView)view.findViewById(R.id.textview); TestDataModel.getInstance().setRetainedTextView(textview);然后就可以运行程序了,别忘了MyApplication 在清单文件中声明
当检测到内存泄漏后,在通知栏中会以通知的形式通知
点进去查看详情
如图:
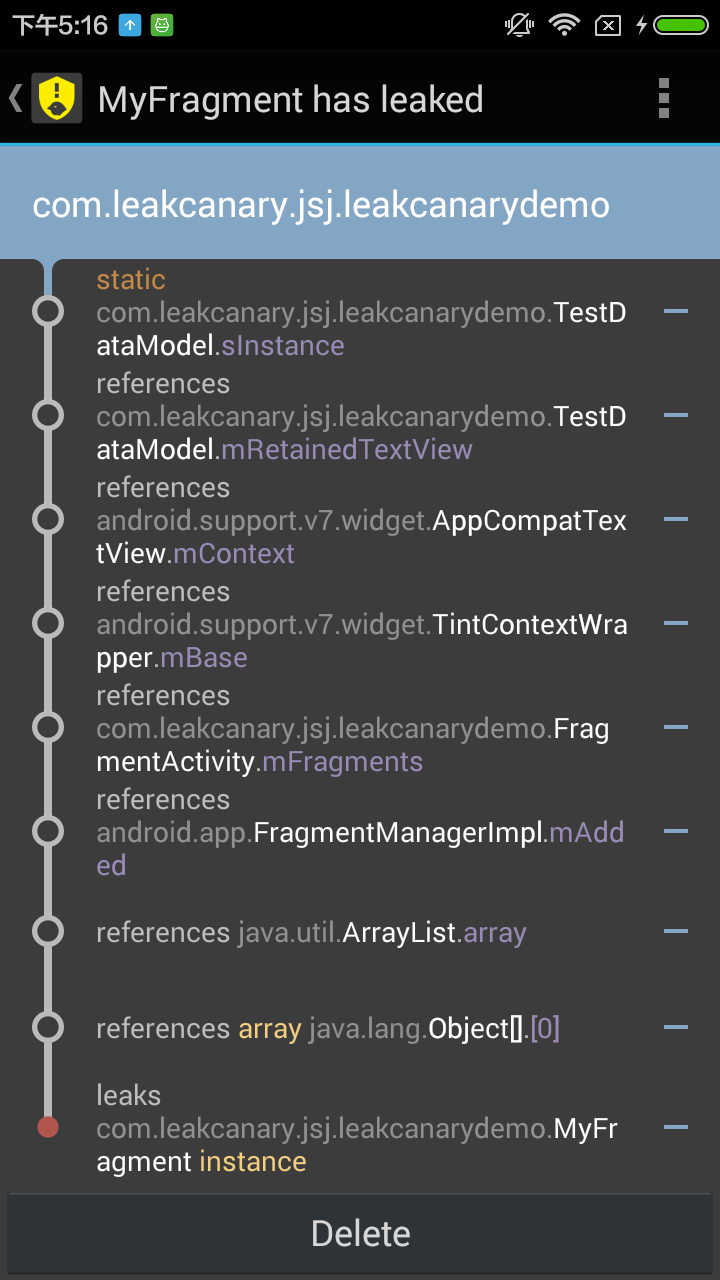
可以详细的看到哪个包中的哪个类哪个变量引起的内存泄漏,很直观
如果想要监控某个可能存在内存泄漏的对象
MyApplication.getRefWatcher().watch(sLeaky);//sLeaky 为要监控的对象其他也可以监控的对象
BroadcastReceiver
Service
其他有生命周期的对象
直接间接持有大内存占用的对象(即Retained Heap值比较大的对象)
SDK 导致的内存泄露
在检测出内存泄漏中,我们甚至可以看到sdk的内存泄漏
随着时间的推移,很多SDK 和厂商 ROM 中的内存泄露问题已经被尽快修复了。但是,当这样的问题发生时,一般的开发者能做的事情很有限。
LeakCanary 有一个已知问题的忽略列表,AndroidExcludedRefs.java,如果你发现了一个新的问题,请提一个 issue 并附上 leak trace, reference key, 机器型号和 SDK 版本。如果可以附带上 dump 文件的 链接那就再好不过了。
对于最新发布的 Android,这点尤其重要。你有机会在帮助在早期发现新的内存泄露,这对整个 Android 社区都有极大的益处。
如何不影响对外版APK
可以看出我们在引入依赖时,都已经区分开了
debugCompile 'com.squareup.leakcanary:leakcanary-android:1.3.1' // or 1.4-beta1
    releaseCompile 'com.squareup.leakcanary:leakcanary-android-no-op:1.3.1' // or 1.4-beta1
    testCompile 'com.squareup.leakcanary:leakcanary-android-no-op:1.3.1' // or 1.4-beta1
debugCompile、releaseCompile、testCompile 提供了三种不同的模式
其中releaseCompile和testCompile这两个的依赖明显不同于debugCompile的依赖。它们的依赖属于NOOP操作。
NOOP,即No Operation Performed,无操作指令。常用的编译器技术会检测无操作指令并出于优化的目的将无操作指令剔除。
因而,只要配置好releaseCompile和testCompile的依赖,就无需担心对外版本的性能问题了


 4万+
4万+


 被折叠的 条评论
为什么被折叠?
被折叠的 条评论
为什么被折叠?
 到【灌水乐园】发言


