


过程:生成网络;随机选择种子节点,按概率传播;更新图中传播节点信息;按时间线绘图保存。
R代码:
transmission_rate = 0.4
coins = c(1, 0)
probabilities = c(transmission_rate, 1-transmission_rate )
# sample(coins, 1, rep=TRUE, prob=probabilities) # Generate a sequence
# toss the coins
toss = function(freq) {
tossing = NULL
for (i in 1:freq ) tossing[i] = sample(coins, 1, rep=TRUE, prob=probabilities)
tossing = sum(tossing)
return (tossing)
}
#更新感染/传播后的节点
update_diffusers = function(diffusers){
nearest_neighbors = data.frame(table(unlist(neighborhood(g, 1, diffusers))))
nearest_neighbors = subset(nearest_neighbors, !(nearest_neighbors[,1]%in%diffusers))
keep = unlist(lapply(nearest_neighbors[,2], toss))
new_infected = as.double(as.character(nearest_neighbors[,1][keep >= 1]))
#the original code in references should be modified to this.
diffusers = unique(c(diffusers, V(g)[new_infected]))
return(diffusers)
}
node_number = 100
library(igraph)
g = graph.tree(node_number, children = 2)
g = graph.star(node_number)
g = graph.full(node_number)
g = graph.ring(node_number)
g = connect.neighborhood(graph.ring(node_number), 2)
g = erdos.renyi.game(node_number, 0.1)
g = rewire(graph.ring(node_number), with = each_edge(prob = 0.8))
g = watts.strogatz.game(1,node_number,3,0.2)
# take this network as example
g = barabasi.game(node_number)
graph_name = "Scale-free network"
plot(g)
seed_num = 1
set.seed(20140301); diffusers = sample(V(g),seed_num)
infected =list()
infected[[1]]= diffusers
# set the color
E(g)$color = "grey"
V(g)$color = "white"
set.seed(2014); layout.old = layout.fruchterman.reingold(g, niter = 1000)
V(g)$color[V(g)%in%diffusers] = "red"
plot(g, layout =layout.old)
total_time = 1
while(length(infected[[total_time]]) < node_number){
infected[[total_time+1]] = sort(update_diffusers(infected[[total_time]]))
cat(length(infected[[total_time + 1]]), "-->")
total_time = total_time + 1
}
plot_time_series = function(infected, m){
num_cum = unlist(lapply(1:m,
function(x) length(infected[[x]]) ))
p_cum = num_cum/node_number
p = diff(c(0, p_cum))
time = 1:m
plot(p_cum~time, type = "b",
ylab = "CDF", xlab = "Time",
xlim = c(0,total_time), ylim =c(0,1))
plot(p~time, type = "h", frame.plot = FALSE,
ylab = "PDF", xlab = "Time",
xlim = c(0,total_time), ylim =c(0,1))
}
plot_time_series(infected, 16)
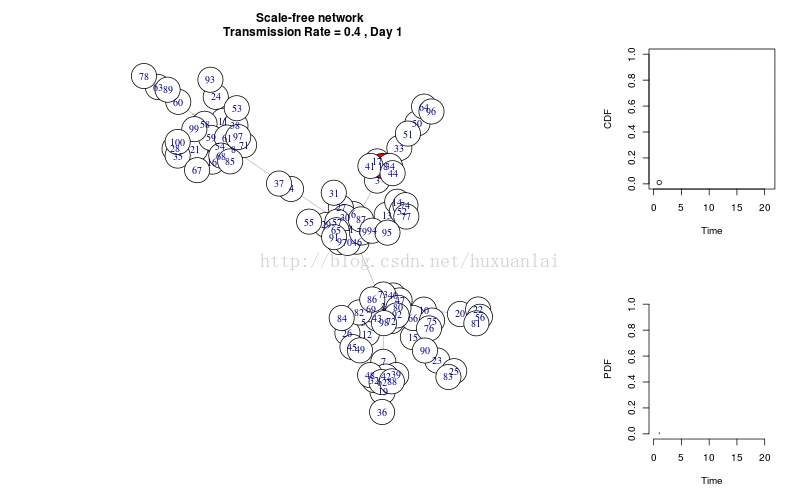
plot_gif = function(infected){
m = 1
while(m <= length(infected)){
layout(matrix(c(1, 2, 1, 3), 2,2, byrow = TRUE), widths=c(3,1), heights=c(1, 1))
V(g)$color = "white"
V(g)$color[V(g)%in%infected[[m]]] = "red"
plot(g, layout =layout.old, edge.arrow.size=0.2)
title(paste(graph_name, "\n Transmission Rate =", transmission_rate, ", Day", m))
plot_time_series(infected, m)
m = m + 1}
}
library(animation)
plot_gif(infected)
saveGIF({
ani.options("convert")
plot_gif(infected)
}, ani.width = 800, ani.height = 500)
参考:
https://chengjunwang.com/network-diffusion 代码需要修改才能正常运行,本文代码主要来源于此。
https://github.com/chengjun/networkdiffusion 代码需要修改才能正常运行,包装成R package形式更方便使用。


 2850
2850


 被折叠的 条评论
为什么被折叠?
被折叠的 条评论
为什么被折叠?
 到【灌水乐园】发言


