


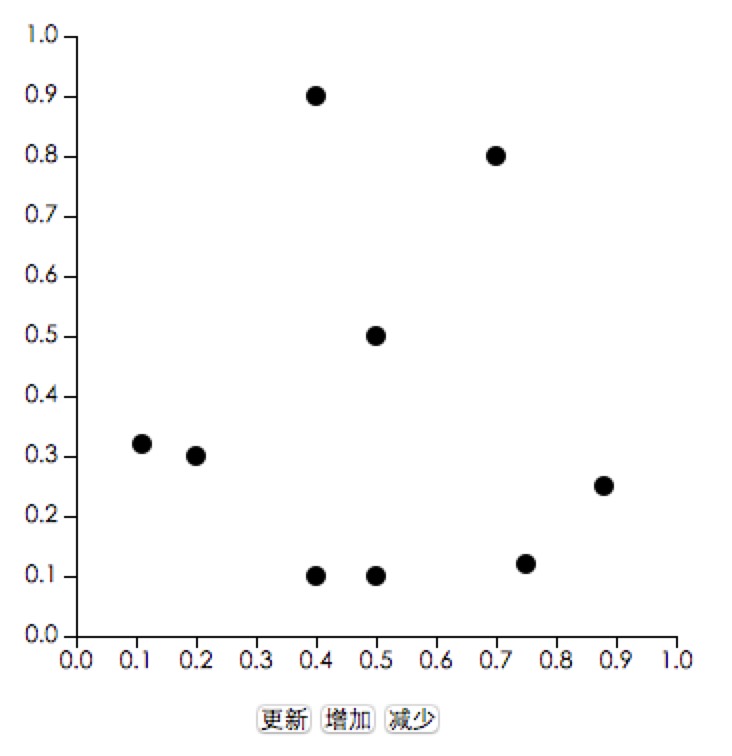
散点图(Scatter Chart),通常是一横一竖两个坐标轴,数据时一组二维坐标,分别对应两个坐标轴,与坐标轴对应的地方打上点。
一、圆点
圆心数据:
var dataset = [[0.5, 0.5],[0.7, 0.8],[0.4, 0.9],
    [0.11, 0.32],[0.88, 0.25],[0.75, 0.12],
    [0.5, 0.1],[0.2, 0.3],[0.4, 0.1]];
定义一个SVG,表示绘制区域:
var width = 400;    // 可视区域宽度
var height = 400;   // 可视区域高度
var padding = {top: 20, right: 20, bottom:20, left:50};

var svg = d3.select("body").select("#content")
        .append("svg")
        .attr("width", width).attr("height", height);
绘制圆点:
function drawCircle(){
    var circleUpdate = svg.selectAll("circle").data(dataset);

    // update处理
    circleUpdate.transition().duration(500)
            .attr("cx", function(d){        // 设置圆心的x坐标
                return padding.left + xScale(d[0]);
            })
            .attr("cy", function(d, i){     // 设置圆心的y坐标
                return height - padding.bottom - yScale(d[1]);
            })
            .attr("r", 5);

    // enter处理
    circleUpdate.enter().append("circle")
            .attr("cx", function(d){
                return padding.left;
            })
            .attr("cy", function(d, i){
                return height - padding.bottom;
            })
            .attr("r", 5)
            .transition().duration(500)
            .attr("cx", function(d, i){
                return padding.left + xScale(d[0]);
            })
            .attr("cy", function(d, i){
                return height - padding.bottom - yScale(d[1]);
            });

    // exit处理
    circleUpdate.exit()
            .transition().duration(500)
            .attr("fill", "white")
            .remove();
}
二、坐标轴
var xAxisWidth = 300;   // x轴宽度
var yAxisWidth = 300;   // y轴宽度
定义比例尺:
var xScale = d3.scale.linear()
        .domain([0, 1])
        .range([0, xAxisWidth]);

var yScale = d3.scale.linear()
        .domain([0, 1])
        .range([0, yAxisWidth]);
添加坐标轴:
function drawScale(){
    var xAxis = d3.svg.axis().scale(xScale).orient("bottom");
    yScale.range([yAxisWidth, 0]);  // 重新设置y轴比例尺的值域,与原来的相反
    var yAxis = d3.svg.axis().scale(yScale).orient("left");

    svg.append("g").attr("class", "axis")
            .attr("transform", "translate("+ padding.left +","+ (height - padding.bottom) +")")
            .call(xAxis);

    svg.append("g").attr("class", "axis")
            .attr("transform", "translate("+ padding.left +","+ (height - padding.bottom - yAxisWidth) +")")
            .call(yAxis);

    // 绘制完比例尺,还原比例尺y轴值域
    yScale.range([0, yAxisWidth]);
}
三、事件
初始化:
window.addEventListener("load", function(){
    drawCircle();
    drawScale();
});
var toFixed = Number.prototype.toFixed;更新:
function update(){
    for(var i = 0, len = dataset.length; i < len; i++){
        dataset[i][0] = +toFixed.call(Math.random(), 2);
        dataset[i][1] = +toFixed.call(Math.random(), 2);
    }
    drawCircle();
}
增加:
function add(){
    dataset.push([+toFixed.call(Math.random(), 2), +toFixed.call(Math.random(), 2)]);
    drawCircle();
}
删除:
function sub(){
    dataset.pop();
    drawCircle();
}
四、完整示例
<!DOCTYPE html>
<html lang="en">
<head>
    <meta charset="UTF-8">
    <title>散点图</title>
    <script src="../../lib/d3/v3/d3.js"></script>
    <style>
        /* 清除样式 */
        *{
            margin: 0;
            padding: 0;
        }
        /* 坐标样式 */
        .axis path, .axis line{
            fill: none;
            stroke: black;
            shape-rendering: crispEdges;
        }
        .axis text{
            font-family: sans-serif;
            font-size: 11px;
        }
        /* 功能按钮 */
        .btnWrap{
            margin-left: 140px;
            margin-top: 10px;
        }
    </style>
</head>
<body>
    <div id="content">
    </div>
    <div class="btnWrap">
        <button type="button" onclick="update();">更新</button>
        <button type="button" onclick="add();">增加</button>
        <button type="button" onclick="sub();">减少</button>
    </div>

    <script>
        var dataset = [[0.5, 0.5],[0.7, 0.8],[0.4, 0.9],
                [0.11, 0.32],[0.88, 0.25],[0.75, 0.12],
                [0.5, 0.1],[0.2, 0.3],[0.4, 0.1]];
        var width = 400;    // 可视区域宽度
        var height = 400;   // 可视区域高度

        var xAxisWidth = 300;   // x轴宽度
        var yAxisWidth = 300;   // y轴宽度

        var padding = {top: 20, right: 20, bottom:20, left:50};

        var svg = d3.select("body").select("#content")
                .append("svg")
                .attr("width", width).attr("height", height);

        /*定义比例尺*/
        var xScale = d3.scale.linear()
                .domain([0, 1])
                .range([0, xAxisWidth]);

        var yScale = d3.scale.linear()
                .domain([0, 1])
                .range([0, yAxisWidth]);

        /* 绘制圆点 */
        function drawCircle(){
            var circleUpdate = svg.selectAll("circle").data(dataset);

            // update处理
            circleUpdate.transition().duration(500)
                    .attr("cx", function(d){
                        return padding.left + xScale(d[0]);
                    })
                    .attr("cy", function(d, i){
                        return height - padding.bottom - yScale(d[1]);
                    })
                    .attr("r", 5);

            // enter处理
            circleUpdate.enter().append("circle")
                    .attr("cx", function(d){
                        return padding.left;
                    })
                    .attr("cy", function(d, i){
                        return height - padding.bottom;
                    })
                    .attr("r", 5)
                    .transition().duration(500)
                    .attr("cx", function(d, i){
                        return padding.left + xScale(d[0]);
                    })
                    .attr("cy", function(d, i){
                        return height - padding.bottom - yScale(d[1]);
                    });

            // exit处理
            circleUpdate.exit()
                    .transition().duration(500)
                    .attr("fill", "white")
                    .remove();

        }

        /* 添加坐标轴 */
        function drawScale(){
            var xAxis = d3.svg.axis().scale(xScale).orient("bottom");
            yScale.range([yAxisWidth, 0]);  // 重新设置y轴比例尺的值域,与原来的相反
            var yAxis = d3.svg.axis().scale(yScale).orient("left");

            svg.append("g").attr("class", "axis")
                    .attr("transform", "translate("+ padding.left +","+ (height - padding.bottom) +")")
                    .call(xAxis);

            svg.append("g").attr("class", "axis")
                    .attr("transform", "translate("+ padding.left +","+ (height - padding.bottom - yAxisWidth) +")")
                    .call(yAxis);

            // 绘制完比例尺,还原比例尺y轴值域
            yScale.range([0, yAxisWidth]);
        }

        // 初始化
        window.addEventListener("load", function(){
            drawCircle();
            drawScale();
        });

        var toFixed = Number.prototype.toFixed;
        /* 更新 */
        function update(){
            for(var i = 0, len = dataset.length; i < len; i++){
                dataset[i][0] = +toFixed.call(Math.random(), 2);
                dataset[i][1] = +toFixed.call(Math.random(), 2);
            }
            drawCircle();
        }

        /* 增加 */
        function add(){
            dataset.push([+toFixed.call(Math.random(), 2), +toFixed.call(Math.random(), 2)]);
            drawCircle();
        }

        /* 删除 */
        function sub(){
            dataset.pop();
            drawCircle();
        }
    </script>
</body>
</html>


 566
566

 被折叠的 条评论
为什么被折叠?
被折叠的 条评论
为什么被折叠?
 到【灌水乐园】发言


