


1.打开Application Verifier ,方法一:在PB菜单Tools->Application Verifier;方法二:打开CETK,连接设备,左键设备,菜单Tools->Application Verifier;
2.在Application Verifier窗口,点击"Add"按钮
3.选择要测试的程序
4.点击"Run"按钮或者直接运行要测试的程序
5.尽量使用要测试的程序
6.点击"Get Logs"按钮,从目标机子复制log文件,或者直接复制
7.点击"View Exported Log "按钮,看log文件,直接选择log文件
1. AppVerifier 的原理是 hook 分配和释放资源的 API ,在程序调用这些 API 时记录信息,在程序退出时报告出未释放的资源。
2. 只能检测 Native 代码。
3. 程序正常退出才行,强行杀进程不能得到正确的报告。
4. 基于原理,只能做 Run-time 检测。尽量使用程序的所有功能已保证检测到更多代码。
测试代码
void LeakMemory ()
{
BYTE * p = new BYTE [ 10 ];
NKDbgPrintfW ( L "Allocated memory: 0x%X" , p );
}
void LeakHandle ()
{
HANDLE h = CreateEvent ( NULL , FALSE , FALSE , L "leaked_event" );
NKDbgPrintfW ( L "Created event: 0x%X" , h );
}
int WINAPI WinMain ( HINSTANCE hInstance , HINSTANCE hPrevInstance , LPTSTR lpCmdLine , int nCmdShow )
{
LeakMemory ();
LeakHandle ();
return 0 ;
}
很简单,泄漏一点内存和一个 Event 句柄。编译该代码生成 Leak.exe/Leak.pdb/Leak.map , AppVerifier 使用 MAP 文件查找调用栈的函数符号。下面我会分别说在 Windows CE 和 Windows Mobile 下的使用。
Windows CE
我是基于 Windows CE 6 测试的。 PB6 已经集成到 Vistual Studio 里了。
1. PB 自带了 AppVerifier, 拷贝 D:/Program Files/Microsoft Platform Builder/6.00/cepb/wcetk/ddtk/armv4i 目录下的下面这些与 AppVerifier 相关的文件到 Release 或者设备的 /Windows 目录。
appverif.exe
htracker.dll
shimexp.exe
shim_heap.dll
shim_hleak.dll
shim_usergdi.dll
shim_verifier.dll
shimeng.dll
vlog.dll
symhlp.dll
在 D:/Program Files/Microsoft Platform Builder/6.00/cepb/wcetk/ddtk 目录下有d esktop/x86/armv4i 等子目录。 Desktop 目录下的文件是运行在 desktop 版 Windows 里 (2000/XP/Vista) 的,需要通过 ActiveSync 或者 KITL 等连接到 Device 上。别的目录是运行在相应平台的 Device 上的。后面 Windows Mobile 里 AppVerifier 的目录结构一样。
上面的 appverif.exe 是 AppVerifier 在 Device 上运行的程序,带 UI ,也支持命令行参数,在 PB 的 Target Control 里输入 s appverif –h 即可看到帮助。
Ø 为了简单,我拷贝了这个目录下所有文件到 Release 目录:
在 PB 里打开 Build Window ,然后
D:/WINCE600>copy "D:/Program Files/Microsoft Platform Builder/6.00/cepb/wcetk/ddtk/armv4i/*" %_FLATRELEASEDIR%
Ø 也可以使用 Remote File Viewer 把这些 AppVerifier 相关的文件拷贝的 /Windows 目录。
2. 拷贝待测试程序和 MAP 文件到 Release 或者 Device 的 Windows 目录,也就是 Leak.exe/Leak.map 。
3. 运行 D:/Program Files/Microsoft Platform Builder/6.00/cepb/wcetk/ddtk/desktop/AppVerifCE.exe (PB 的安装目录下 )
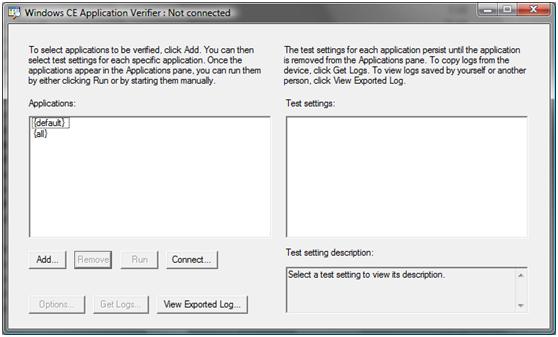
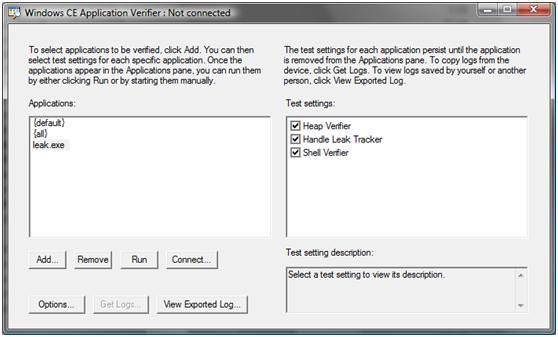
4. 选择 Add… ,输入待检测的 exe 文件名 Leak.exe ,不用全路径,并选中右边 Test settings 里要测试的项目,一般全选
5. 选择 Connect…
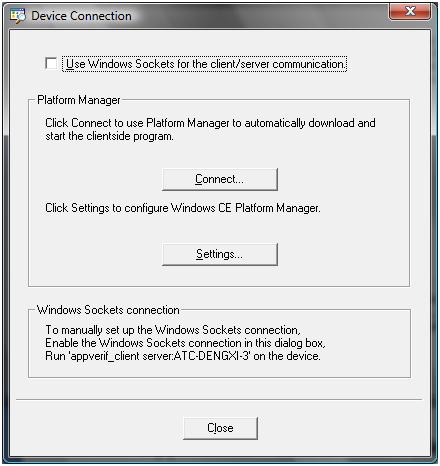
6. 选择 Connect…
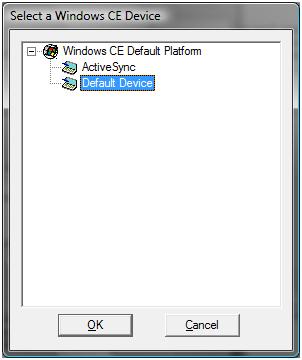
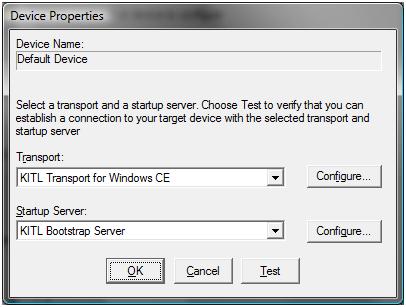
这里选要连接的 Device ,我这里选 Default Device ,属性如下,运行在 Device Emulator 里带 KITL 的 image 。
7. 连接成功以后运行 Leak.exe ,在 PB 的 Target Control 里输入 s Leak.exe 。可以看到 Output 窗口里有如下输出:
1532862 PID:206001e TID:207001e Allocated memory: 0x2C022DD0 // 这两行是程序输出的
1532878 PID:206001e TID:207001e Created event: 0x521603
1532985 PID:206001e TID:207001e Application verifier core unloaded from: leak.exe - 11:39:44 PM
1533001 PID:206001e TID:207001e DLL_PROCESS_DETACH: Shim_heap checking for abandoned heaps/allocations...
1533094 PID:206001e TID:207001e Heap statistics for heap 0x2c020010:
1533108 PID:206001e TID:207001e Initial size: 0, Maximum size: 0
1533122 PID:206001e TID:207001e Current bytes: 10, Max: 10
1533136 PID:206001e TID:207001e Current count: 1, Max: 1
1533150 PID:206001e TID:207001e Free list bytes: 0
1533164 PID:206001e TID:207001e Free list size: 0
1533183 PID:206001e TID:207001e Checking for un-freed items in heap 0x2c020010...
1533244 PID:206001e TID:207001e ----------------------------------------
1533260 PID:206001e TID:207001e TrackedItem count: 1
1533273 PID:206001e TID:207001e Callstack:
1533368 PID:206001e TID:207001e Console NOT redirected for process 0x206001E
1533506 PID:400002 TID:207001e RELFSD: Opening file shim_heap.map from desktop
1535138 PID:206001e TID:207001e 0x41e98310: shim_heap.dll!APIHook_HeapAlloc + 5d0h
1535220 PID:206001e TID:207001e 0x41e9b378: shim_heap.dll!APIHook_LocalAlloc + a8h
1535303 PID:206001e TID:207001e 0x41e9c2f4: shim_heap.dll!APIHook_malloc + 18h
1535392 PID:206001e TID:207001e 0x41e9c54c: shim_heap.dll!APIHook_new + 14h
1535596 PID:400002 TID:207001e RELFSD: Opening file leak.map from desktop
1535746 PID:206001e TID:207001e 0x000110e0: leak.exe!?LeakMemory@@YAXXZ + ch // 这是内存泄漏的调用栈
1535892 PID:206001e TID:207001e 0x0001116c: leak.exe!WinMain + 10h
1536088 PID:206001e TID:207001e 0x00011208: leak.exe!WinMainCRTStartupHelper + 28h
1536210 PID:206001e TID:207001e 0x000111cc: leak.exe!WinMainCRTStartup + 20h
1536341 PID:400002 TID:207001e RELFSD: Opening file coredll.map from desktop
1546679 PID:206001e TID:207001e 0x40071f5c: coredll.dll!MainThreadBaseFunc + 2a0h
1546768 PID:206001e TID:207001e Un-freed items:
1546854 PID:206001e TID:207001e 0x2c022dd0 10 bytes, process: 0x0206001e, thread:// 泄漏的内存地址和大小,可以看出和程序里的一致
0x0207001e, PerfCount: 1021127120
1546941 PID:206001e TID:207001e Total: 10 bytes
1547026 PID:206001e TID:207001e Checking for leaks in marshall helper api's...
1547043 PID:206001e TID:207001e ------------------------------------------------------------------------
1547045 PID:206001e TID:207001e Shim HLeak detaching from process /Release/leak.exe
1547046 PID:206001e TID:207001e Num of un-freed handles = 1
1547046 PID:206001e TID:207001e Check log file for details
1547046 PID:206001e TID:207001e ------------------------------------------------------------------------
1547047 PID:206001e TID:207001e ----------------------
1547256 PID:206001e TID:207001e EVENT Handle = 0x00521603 Name: 'leaked_event' PerfCount: 1021895588 // 泄漏的句柄,可以看出何程序里是一样的
1547338 PID:206001e TID:207001e Callstack:
1547430 PID:400002 TID:207001e RELFSD: Opening file shim_hleak.map from desktop
1548302 PID:206001e TID:207001e 0x41e84814: shim_hleak.dll!My_TrackerInsertItem2 + e0h
1548409 PID:206001e TID:207001e 0x41e84710: shim_hleak.dll!My_TrackerInsertItem + 24h
1548486 PID:206001e TID:207001e 0x41e84c00: shim_hleak.dll!APIHook_CreateEventW + 68h
1548653 PID:206001e TID:207001e 0x0001112c: leak.exe!?LeakHandle@@YAXXZ + 18h // 泄漏句柄的调用栈
1548819 PID:206001e TID:207001e 0x00011170: leak.exe!WinMain + 14h
1548979 PID:206001e TID:207001e 0x00011208: leak.exe!WinMainCRTStartupHelper + 28h
1549136 PID:206001e TID:207001e 0x000111cc: leak.exe!WinMainCRTStartup + 20h
1549219 PID:206001e TID:207001e 0x40071f5c: coredll.dll!MainThreadBaseFunc + 2a0h
1549240 PID:206001e TID:207001e DLL_PROCESS_DETACH: Shim_usergdi checking for abandoned resources...
1549340 PID:206001e TID:207001e --------------------------------------------------------------------------------
1549355 PID:206001e TID:207001e VLOG exiting - check for verifier logs (22 info, 5 warnings, 0 errors)
1549368 PID:206001e TID:207001e Process log: /release/AppVerifier_leak_2339.log // 这是日志文件,文本格式,可以直接打开看
1549381 PID:206001e TID:207001e --------------------------------------------------------------------------------
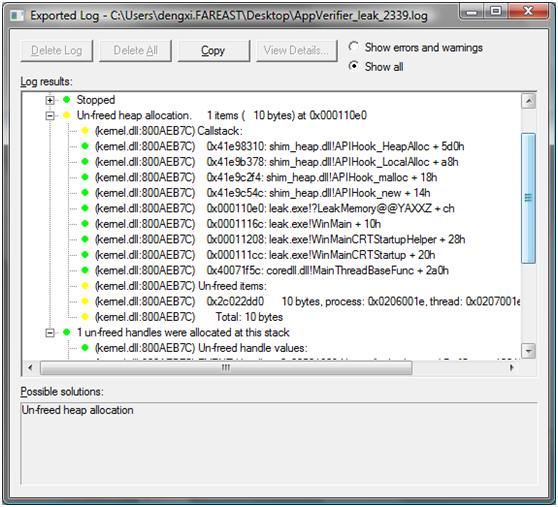
对于日志文件,也可以在图1 的界面里选择 Get Logs… 保存日志到本地,然后选择 View Exported Log… 看,如本测试的日志文件
Windows Mobile
1. 去下面地址下载安装。虽然写的是 for Windows Mobile 5 ,但也适用于 Windows Mobile 6 。
注意 Instructions 节里的:
For systems that have never installed Platform Builder, complete the following additional steps:
1. Install the Windows CE 5.0 Stand Alone CETK (this provides connection libraries needed).
2. Replace the Application verifier binaries in the processor folder for the device type. For example, replace C:/Program Files/Windows CE platform builder/5.00/CEPB/wcetk/DDTK/ARMV4I with C:/Program Files/Application Verifier for Mobile 5.0/Armv4i .
当你需要在 Desktop 上运行 AppVerifier 然后连接 Device( 像我在演示 Windows CE 里做的 ) 时需要做这两步。我下面将演示直接在 Device 上运行,所以不用这两步。
2. 启动 Mobile 设备,我这里用的 Device Emulator
3. 拷贝 D:/Program Files/Application Verifier for Mobile 5.0/Armv4i 目录下的与 AppVerifier 相关的文件到 Device Emulator 里的 Windows 目录。
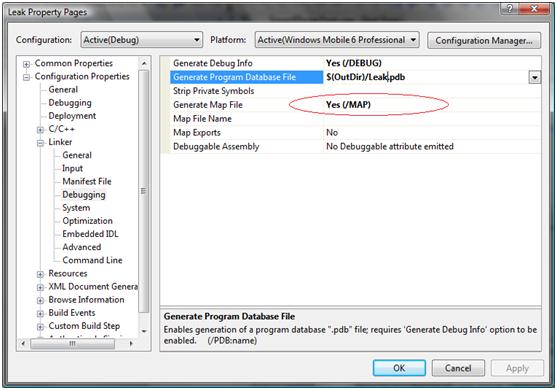
4. 拷贝待测试程序和 MAP 文件到 Device ,也就是 Leak.exe/Leak.map ,其中 Leak.map 得拷贝到 /Windows 目录,不然生成的日志里看不到函数符号。生成 MAP 文件需要修改工程属性如下,改 Generate Map File 为 Yes 。
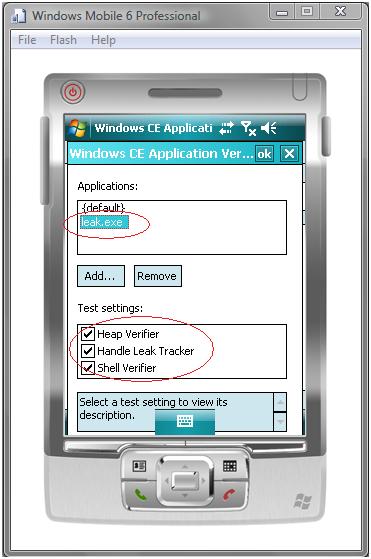
5. 在 Device Emulator 里运行 /Windows/AppVerif.exe ,选择 Add… 添加 Leak.exe 并选择 Test settings 。
6. 在 Device 上运行 Leak.exe ,会在 Device 的根目录生成日志文件,比如 / AppVerifier_Leak_1643.log 。直接用记事本打开就可以看到日志,或者运行 D:/Program Files/Application Verifier for Mobile 5.0/Desktop/ AppVerifCE.exe ,然后选择 View Exported Log… 看。
7. 发现有时候打开log,里面的符号不能被正确解析。解决方法:
1) 打开log文件, 把类似下面callstack里不正确解析的符号
| shim_heap.dll 30 | 0 nk.exe 8803754c' 0x1c04eac4: !(null) + 4eac4h
| shim_heap.dll 30 | 0 nk.exe 8803754c' 0x1c04b2f0: !(null) + 4b2f0h
| shim_heap.dll 30 | 0 nk.exe 8803754c' 0x1c04bad4: !(null) + 4bad4h
| shim_heap.dll 30 | 0 nk.exe 8803754c' 0x1c0530f0: !(null) + 530f0h
都改为:
| shim_heap.dll 30 | 0 nk.exe 8803754c' 0x1c04eac4: leak.exe!(null) + 4eac4h
然后像第6步里一样打开log,会提示map文件的位置,选择即可。
2) 手动在map文件里找地址。比如上面的!(null) + 4eac4h, 在map文件的第3列,也就是Rva+Base,里找第一个比4eac4h小的地址就是了。
Windows Desktop(2000/XP/Vista…)
AppVerifier 也有 Windows desktop 上的版本,可惜不支持 Memory Leak 等检测,但说明说可以检测 double free 。不知道有什么好的检测资源泄漏的方案?听过 BoundsChecker , Rational Purify 。了解的朋友请告诉我下。
之外,可以修改代码使用 C Run-time 库提供的些函数辅助检查。 Debug 版本下,在程序退出前加 _CrtDumpMemoryLeaks ,可以打出泄漏内存的内容,不过没有调用栈,比如 :
Detected memory leaks!
Dumping objects ->
{ 110 } normal block at 0x00917D88, 4 bytes long. //110 是内存分配的 ID
Data: < > 01 00 00 00 // 这是泄漏的内容 , 可以根据大小和内容大概猜是什么东西
Object dump complete.
每个内存分配有个 ID ,比如上面 110 , 然后在程序入口处 _CrtSetBreakAlloc(110) ,再重新开始 debug ,下次分配这个对象时就会断下来,你就可以看到调用栈了。如果每次分配内存的顺序是一样的, ID 在多次运行程序会一样,这种方法不错,但在多线程环境下有局限。 这种方法类似于 ATL 的 QIThunk , 见 ATL Internals: Working with ATL 8, Second Edition 第 4 章的 Debugging 节。
附录
1. Application Verifier for Windows CE and Windows Mobile 5.0
http://msdn.microsoft.com/en-us/library/aa446904.aspx
2. 视频教材 Using AppVerifier to debug Windows Mobile Applications


 3421
3421


 被折叠的 条评论
为什么被折叠?
被折叠的 条评论
为什么被折叠?
 到【灌水乐园】发言


