


《Python机器学习实践》笔记
参考资料:
《python机器学习及实践 从零开始通往Kaggle竞赛之路》范淼,李超2016
常用python库
- Numpy & Scipy 高级数学运算、科学计算
- Matplotlib 绘图工具包
- Scikit-learn 封装了大量机器学习模型
- Pandas 针对数据分析和处理的工具包,常用于数据预处理
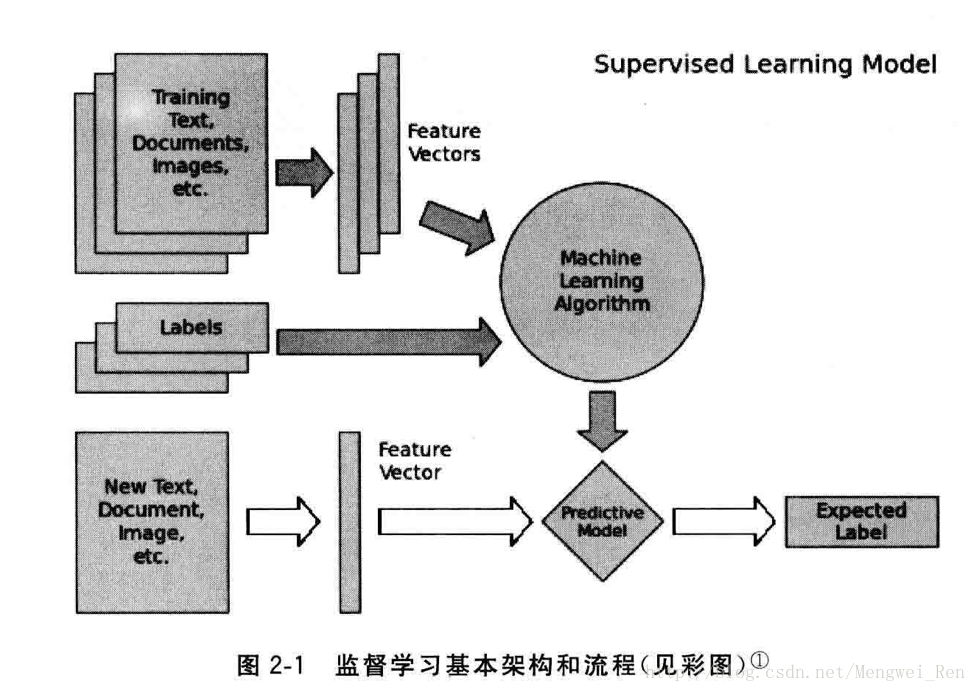
监督学习经典模型
分类学习
分类学习包括二分类问题、多类分类问题、多标签分类问题等。
1.线性分类器
- 简要介绍
线性分类器是一种假设特征与分类结果存在线性关系的模型,通过累加计算每个维度的特征与各自权重的成绩来帮助类别决策。
定义x =
- 肿瘤预测代码实现
1. 关键函数
train_test_split #用于将数据集划分,一部分用于训练,一部分用于测试
一个关于train_test_split的例子,使用iris数据集
>>> import numpy as np
>>> from sklearn.model_selection import train_test_split
>>> from sklearn import datasets
>>> from sklearn import svm
>>> iris = datasets.load_iris()
>>> X_train,X_test,y_train,y_test = train_test_split(iris.data,iris.target,test_size=0.4,random_state=0)
>>> iris.data.shape,iris.target.shape
((150, 4), (150,))
>>> X_train.shape, y_train.shape
((90, 4), (90,))
>>> X_test.shape, y_test.shape
((60, 4), (60,))
iris数据集说明:
>>>iris.DESCR
:Number of Instances: 150 (50 in each of three classes)
:Number of Attributes: 4 numeric, predictive attributes and the class
:Attribute Information:
    - sepal length in cm
    - sepal width in cm
    - petal length in cm
    - petal width in cm
    - class:
            - Iris-Setosa
            - Iris-Versicolour
            - Iris-Virginica
:Summary Statistics:

============== ==== ==== ======= ===== ====================
                Min  Max   Mean    SD   Class Correlation
============== ==== ==== ======= ===== ====================
sepal length:   4.3  7.9   5.84   0.83    0.7826
sepal width:    2.0  4.4   3.05   0.43   -0.4194
petal length:   1.0  6.9   3.76   1.76    0.9490  (high!)
petal width:    0.1  2.5   1.20  0.76     0.9565  (high!)
============== ==== ==== ======= ===== ====================

:Missing Attribute Values: None
:Class Distribution: 33.3% for each of 3 classes.
:Creator: R.A. Fisher
:Donor: Michael Marshall (MARSHALL%PLU@io.arc.nasa.gov)
:Date: July, 1988
sklearn中的iris数据集有5个key:
[‘target_names’, ‘data’, ‘target’, ‘DESCR’, ‘feature_names’]
target_names : 分类名称
[‘setosa’ ‘versicolor’ ‘virginica’]
target:分类(150个)
(150L,)[0 0 0 0 0 0 0 0 0 0 0 0 0 0 0 0 0 0 0 0 0 0 0 0 0 0 0 0 0 0 0 0 0 0 0 0 0
0 0 0 0 0 0 0 0 0 0 0 0 0 1 1 1 1 1 1 1 1 1 1 1 1 1 1 1 1 1 1 1 1 1 1 1 1
1 1 1 1 1 1 1 1 1 1 1 1 1 1 1 1 1 1 1 1 1 1 1 1 1 1 2 2 2 2 2 2 2 2 2 2 2
2 2 2 2 2 2 2 2 2 2 2 2 2 2 2 2 2 2 2 2 2 2 2 2 2 2 2 2 2 2 2 2 2 2 2 2 2
2 2]
feature_names: 特征名称
(‘feature_names:’, [‘sepal length (cm)’, ‘sepal width (cm)’, ‘petal length (cm)’, ‘petal width (cm)’])
data : 特征值 (150L, 4L)
data[0]:[ 5.1 3.5 1.4 0.2]
其他sklearn常见数据集参考:
代码不说谎: sklearn学习(1) 数据集
2. 分类器
在这里用到的模型是Logistic Regression和SGDClassifier,前者对参数计算采用精确解析方式,计算时间长,模型性能高;后者采用随机梯度上升算法估计模型参数,计算时间短但性能略低。一般在训练规模10万量级以上的数据,更推荐用随机梯度算法
3. 思路
基本的流程大致分为:数据预处理、数据集划分、训练、预测、性能分析。
- 数据预处理包括:将代表缺失数据的值替换为标准numpy中的NaN表示,然后丢掉/处理这些缺失数据
- 数据集划分利用train_test_split()实现
- 训练分别用LogisticRegression()和SGDClassifier(),训练集是第二步中划分出来的X_train,y_train
- 预测采用X_test
- 性能分析:用y_test比较性能,性能指标有准确率、召回率、f1-score等(适用于二分类任务)。
4. 代码
# -*- coding: utf-8 -*-
import pandas as pd
import numpy as np
from sklearn.model_selection import train_test_split
from sklearn.preprocessing import StandardScaler
from sklearn.linear_model import LogisticRegression
from sklearn.linear_model import SGDClassifier
from sklearn.metrics import classification_report


'''
dataset
Number of Instances: 699 (as of 15 July 1992)
Number of Attributes: 10 plus the class attribute
Attribute Information: (class attribute has been moved to last column)

   #  Attribute                     Domain
   -- -----------------------------------------
   1. Sample code number            id number
   2. Clump Thickness               1 - 10
   3. Uniformity of Cell Size       1 - 10
   4. Uniformity of Cell Shape      1 - 10
   5. Marginal Adhesion             1 - 10
   6. Single Epithelial Cell Size   1 - 10
   7. Bare Nuclei                   1 - 10
   8. Bland Chromatin               1 - 10
   9. Normal Nucleoli               1 - 10
  10. Mitoses                       1 - 10
  11. Class:                        (2 for benign, 4 for malignant)
'''
# feature list
column_names = ['Sample code number','Clump Thickness','Uniformity of Cell Size','Uniformity of Cell Shape',
'Marginal Adhesion','Single Epithelial Cell Size','Bare Nuclei','Bland Chromatin','Normal Nucleoli','Mitoses', 'Class'];

data = pd.read_csv('https://archive.ics.uci.edu/ml/machine-learning-databases/breast-cancer-wisconsin/breast-cancer-wisconsin.data',names = column_names)

#data pre-processing
#1. replace the omitted data to standard np.nan
data = data.replace(to_replace='?', value = np.nan)

#2. drop those with NaN values
data = data.dropna(how = 'any')

#print data.shape #test processed data set

'''
X_train, X_text, y_train, y_test = train_test_split(train_data, train_target, test_size, random_state)
[params]
train_data: the original data set which will be split
train_target: the splitting result
test_size: test percentage
random_state: randomize

'''

#split the data, reserving 25% of them for testing
X_train, X_text, y_train, y_test = train_test_split(data[column_names[1:10]],data[column_names[10]],test_size=0.25,random_state=33)

#print y_train.value_counts()
print y_test.value_counts()
ss = StandardScaler() #standadize data
最低0.47元/天 解锁文章


 220
220


 被折叠的 条评论
为什么被折叠?
被折叠的 条评论
为什么被折叠?
 到【灌水乐园】发言


