


TOP命令:
1) P 按照cpu使用率排序;
M 按照memory使用率排序 ;
T 按照Time+(使用cpu时间的累加值)排序 ;
数字键1: ”cpu聚合“ 和 ”单个cpu情况“ 切换
2) top -Hp xxxPid: 显示这个xxxPid中的线程的情况
3)
查看内存:
查看磁盘:
===========================================================
1. top命令
1.1 top命令界面说明
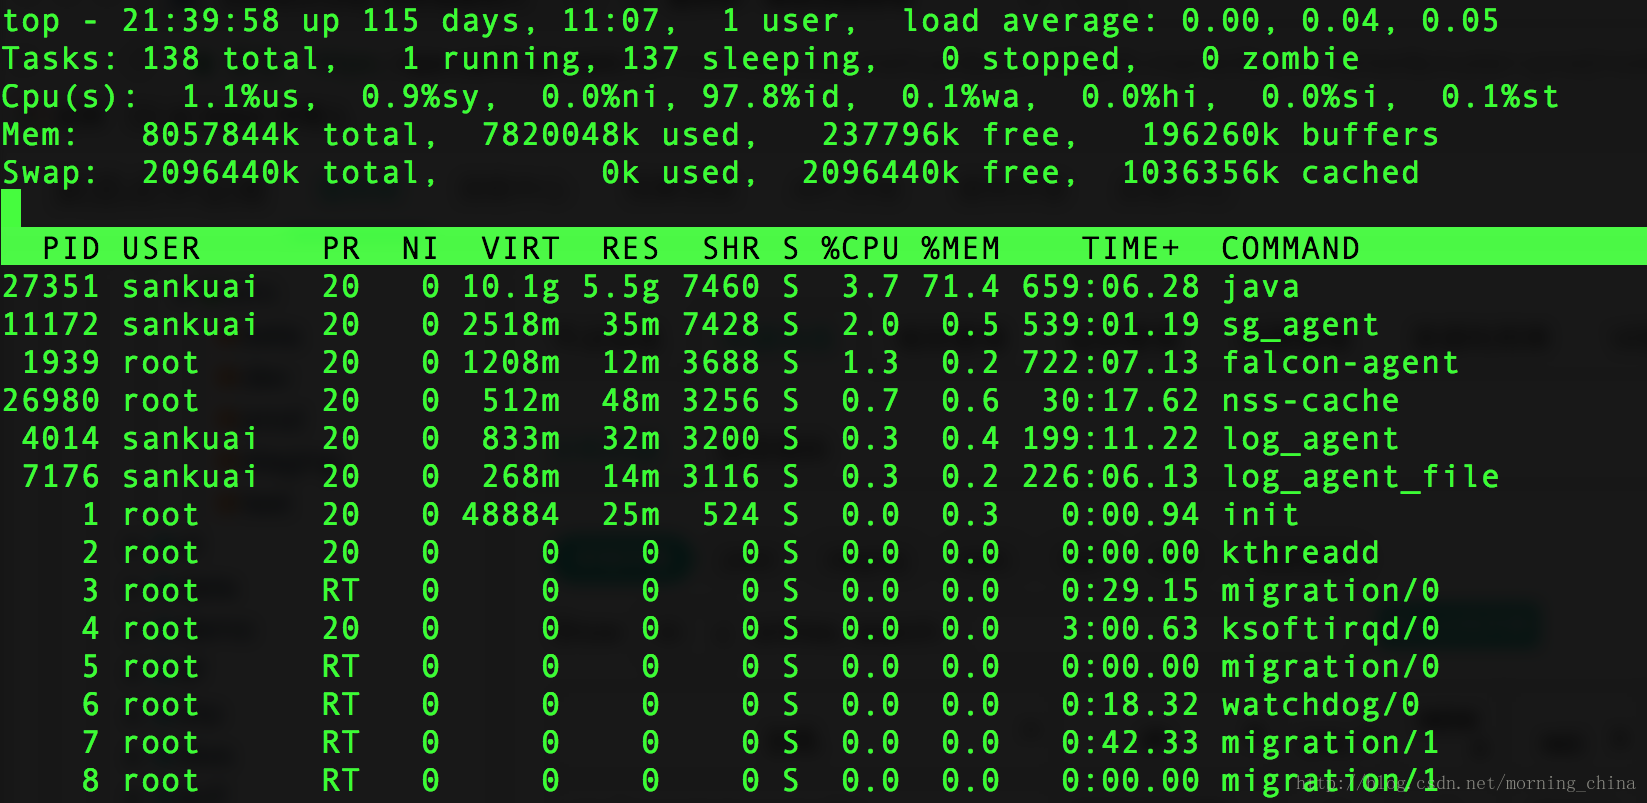
系统当前时间、系统运行时间、当前登录用户数、系统平均负载(即任务队列的平均长度,这三个值分别表示1分钟,5分钟,15分钟到现在的平均值);
正在运行的进程数、睡眠进程数、停止的进程数、僵尸进程数;
us:用户空间cpu占用率、sy:内核空间CPU占用率、ni:用户进程空间改变过优先级的进程cpu占用率、id:空闲cpu占用率、wa:表示等待输入输出的cpu时间百分比、hi:表示硬终端请求、si:表示软件终端请求;
物理内存总量、已使用的物理内存、空闲物理内存、内核缓冲使用量;
交换区总量、交换区已使用量、交换区空闲量、缓冲交换区大小;
PID:进程id
PPID:父进程Id
RUSER:Real user name
UID:进程所有者的用户id
USER:进程所有者的用户名
GROUP:进程所有者的组名
TTY:启动进程的终端名。不是从终端启动的进程则显示?
PR:进程优先级
NI:nice值,负值表示高优先级,正值表示低优先级
P:当前进程最后使用的cpu,仅在多cpu环境下有意义
%CPU:上次更新到现在的CPU时间占用百分比
TIME:进程使用的CPU时间总计,单位秒。
TIME+:进程使用的CPU时间总计,单位1/100秒
%MEM:进程使用的物理内存百分比
VIRT:进程使用的虚拟内存总量,单位KB。 VIRT=SWAP+RES
SWAP:进程使用的虚拟内存中被换出的大小,单位KB
RES:进程使用的、未被换出的物理内存大小,单位KB。 RES=CODE + DATA
CODE:可执行代码占用的物理内存大小,单位KB。
DATA:可执行代码以外的部分(数据段+栈)占用的物理内存大小,单位KB
SHR:共享内存带下,单位KB
nFLT:页面错误次数
nDRT:最后一次写入到现在,被修改过的页面数
S:进程状态。D表示不可中断的睡眠状态;R表示运行;S表示睡眠;T表示跟踪/停止;Z表示僵尸进程
COMMAND:命令名/命令行
WCHAN:若该进程在睡眠,则显示睡眠中的系统函数名
Flags:任务标志,参考sched.h
top命令界面上,与top进行交互:
?:帮助,显示在top界面上可以输入哪些按键,具体是什么作用
P:以CPU的使用率进行排序
M:以内存的使用率进行排序
N: 以PID来排序
T: Process 使用的CPU时间累积(TIME+)排序
k:给予某个PID一个信号
r:设置某个PID的nice值
q:离开
数字1键: 在”CPU聚合情况“和”单个cpu“间切换。
1.2 top命令说明
top [-d xx] | top [-bmp]
-d xx 每多少秒刷新一次top界面
-b 以批次的方式执行top
-n 执行多少次
-p 指定某个进程, 也就是只显示这个进程的情况
非常重要的一个命令,显示某个进程的所有线程的情况:
top -Hp xxxPid: 显示这个xxxPid中的线程的情况
top命令结果写入文件:
top -b -n 2 > /some/path/top.txt
2. sar命令
sar system activity reporter
sar是linxu系统中重要的性能监测工具之一,它可以周期性的堆内存和CPU的使用情况进行采样。
sar [ options ] [<interval> [ <count>]]
interval :采样周期 count:采样数量 options:对哪些性能数据进行采样
-A:所有报告的综合
-u:CPU利用率
-d:硬盘使用报告
-b: I/O的情况
-q: 查看队列长度
-r: 内存使用统计信息
-n: 网络信息统计
-o: 采样结果输出到文件
3. vmstat命令
3.1 vmstat命令界面说明
| 大类 | 说明 |
| Process | r:运行的和等待运行的进程数,关注下这个数字和CPU逻辑核数的关系。 如果这个数字长期大于逻辑内核数,则可能需要增加CPU了 b:处于block状态的进程数,常见情况是由IO引起的 |
| Memory | swpd:切换到交换内存上的大小(KB)。swpd不为0,则表明有内存中的数据交换到硬盘的swpd区了。 如果si so的值长期为0, 则也不会影响性能。(只要不是频繁的来回交换,就不是很影响性能) free 空闲的物理内存,单位KB buff 对块设备读写进行缓冲(被用来作为缓存的内存数,单位KB) cache 对文件进行缓存。 文件cache 跟 bi bo有关系。 |
| Swap | si:由磁盘调入内存(从磁盘交换到内存的交换页数量,单位KB/秒) so: 由内存调入磁盘(从内存交换到磁盘的交换页数量,单位KB/秒) 内存够用时,以上两个值都是0.如果这两个值长期大于0,则系统性能会受影响。 |
| IO | bi: 读IO(从块设备接收到的块数,单位 块/秒) bo: 写IO(发送到块设备的块数,单位 块/秒) |
| System | in:每秒的中断数,包括时钟中断 cs:每秒的上下文切换次数 |
| CPU | us:用户CPU使用时间 sy:内核CPU系统使用时间 id:空闲时间 |
3.2 vmstat命令说明
命令格式:vmstat delay count 间隔delay秒取一次样,取样count次
系统级的 cpu 内存 虚拟内存 io 的使用情况
eg: vmstat 1 每一秒取样一次,取无限次
vmstat 1 100 每一秒取样一次, 取100次
4. iostat命令
iostat命令可以提供详尽的IO信息。磁盘IO很容易成为系统性能瓶颈,通过iostat可以快速定位系统是否产生了大量的IO操作。
命令格式: iostat 1 10 采集CPU和IO的数据,每秒采集1次,一共采集10次
iostat -d 1 10 只采集IO的
iostat -x 1 10 可以获得更多信息
tps:该设备每秒的传输次数
kB_read/s:每秒从设备读取的数据量
kB_wrtn/s:每秒向设备写入的数据量
kB_read:读取的总数据量
kB_wrtn:写入的总数据量
5. pidstat命令
pidstat工具不仅能够监视进程的性能情况,也能监视线程的性能情况
(性能情况 既包括cpu的使用情况,也包括IO的使用情况和内存的使用情况)。
对CPU进行监控:
pidstat -p xxxPID -u 1 3 (-p指定进程ID, -u 表示对CPU使用率的监控)
pidstat -p xxxPID 1 3 -u -t (-t 参数可以对线程进行监控)
对IO进行监控:
pidstat -p xxxPID -d -t 1 3
对内存进行监控:
pidstat -r -p xxxPID 1 3
=================================
1. CPU各内核状态
mpstat -P ALL 1
2. jps -lv 查看java进程id
-l 输出应用主类名(包名+类名)
-v 输出JVM参数
3. pidstat report statistics for linux task (显示进程或者任务的相关统计信息)
进程或者任务级的统计信息(cpu 内存 设备io 任务切换 线程等等)
pidstat -p 进程号 -t
-p 指定进程号
-t 显示与所选任务相关的线程的统计数据-----线程级
4. top也可以显示线程级
top -Hp xxx进程号
5. 将十进制进程号(线程号)转成十六进制
printf '%x\n' xxxx
或者 echo “obase=16;xxxx” | bc
6. 获得线程栈
jstack -l xxxx | grep -iA 20 "十六进制"
========================================================
1. CPU监控
1.1 CPU使用率
1.2 调度程序的运行队列长度
A general guideline to follow is observing run queue depths over an extended period of time greater than 1 times the number of virtual processors is something to be concerned about but may not require urgent action. Run queue depths at 3 to 4 times, or greater, than the number of virtual processors over an extended time period should be considered an observation that requires immediate attention or action.
2. 内存监控
2.1 内存使用率
2.2 swapping activity
vmstat top 或者查看 /proc/meminfo 文件的内容
3. Monitoring Lock Contention on Solaris
Many Java applications that do not scale suffer from lock contention. Identifying that lock contention in Java applicaitons can be difficult and the tools to identify lock contention are limited.
In addition, optimizations have been made in modern JVMs to improve the performance of applications that experience lock contention. For example, in Java 5, optimizations were integrated into the Java HotSport Vm to implement much of the locking logic, the artifact resulting from Java synchronized methods and synchronized blocks, ,in user code rather than relying immediately on operating system lock primitives. Prior to Java 5, the HotSport VM delegated almost all of the locking logic to operationg system locking primitives. This allowed for operationg system tools such as Solaris mpstat to easily monitor a Java application for lock contention by observing the "smtx" (spin on mutex) column along with observing system or kernel CPU utilization.
As a result of the Java 5 HotSpot VM optimizations to implement much of locking logic in user code, using Solaris mpstat and observiing the "smtx" column and "sys" CPU utilizaiotn columns no longer work as well. Instead, an alternative approach is needed.
A high level simplistic description of the lcok optimization added to Java 5 HotSpot VMs and later is given as follows; spin in a tight loop trying to acquire a lock, if not successful after a number of tight loop spins, park the thread and wait to be notified when to try acquiring the lock again. The act of parking a thread along with awaking a thread results in an operating system voluntary context switch. Hence, an application experiencing heavy lock contention exhibits a high number of voluntary context switches. The cost of a voluntarty context switch at a processor clock cycle level is an expensive operation, generally upwards of about 80000 clock cycles.
Context switching can be monitored on Solaris with mpstat by observing the "csw" column. The value reported by the "csw" column in mpstat is the total number of context switches including involuntary context switches. Involuntary context switing is also reported in mpstat in the "icsw" column. Hence, the number of voluntary context switches is the "csw" minus "icsw".
A general rule to follow is that any Java application experiencing 5% or more of its available clock cycles in voluntary context switches is likely to be suffering from lock contention. Even a 3% to 5% level is worthy of further investigation. An estimate of the number of clock cycles spent in voluntary context switching can be calculated by taking the number of thread context switches (csw) observed in an mpstat interval, minus the involuntary context switches observed in an mpstat interval (icsw), multiplying that number by 80,000 (the general cost of a context switch in munber clock cycles), and dividing it by the total number of clock cycles available in the mpstat interval.
4. Monitoring Lock Contention on Linux
It is possible to monitor lock contention by observing thread context switches in Linux with the pidstat command from the sysstat package. However, for pidstat to report context switching activity, a Linux Kernel version of 2.6.23 or later is required. The use of pidstat -w reports voluntary context switches in a "cswch/s" column. It is important to notice that Linux pidstat -w reportes voluntary context switches, not a sum of all context switches that Solaris mpstat reports. Additionally, Linux pidstat -w reports the number of voluntary context switches per second, not per measurement interval like Solaris mpstat. Therefore, the estimate of the percentage of clock cycles wasted on voluntary context switching is calculated as the number of pidstat -w voluntary context switches divided by the number of virtual processors.
5. Monitoring Thread Migrations
线程迁移,指的是 某线程显示在A processor上运行,后来A processor过于忙碌,只好迁移到B processor上运行。
线程调度程序会优先将 线程 分配给 上次运行它的 processor上的
线程频繁迁移会影响性能,因为processor的缓存中可能没有线程运行所需要的数据
6. Network I/O Utilizaiton


 244
244


 被折叠的 条评论
为什么被折叠?
被折叠的 条评论
为什么被折叠?
 到【灌水乐园】发言


