


泄露并不是真正意思的泄露,而是因为内存不能被GC,从而导致占用内存过大,发生Out of Memory,而被系统Kill。
adb shell getprop | grep dalvik:
[dalvik.vm.heapsize]: [64m]
LMK(LowMemoryKiller)会周期性的运行,工作时,首先根据下面的值确定当前的警戒级数,高于警戒级数的进程是待杀的范围。若找到多个,则把占用进程最大的进程,发送SIGKILL,杀掉该进程。
而Android也会在E:\Src\IceCreamSandwich\frameworks\base\services\java\com\android\server\am\ActivityManagerService.java中去动态的调整每一个app的Level。
# Define the oom_adj values for the classes of processes that can be killed by the kernel.
setprop ro.FOREGROUND_APP_ADJ 0
setprop ro.VISIBLE_APP_ADJ 1
setprop ro.PERCEPTIBLE_APP_ADJ 2
setprop ro.HEAVY_WEIGHT_APP_ADJ 3
setprop ro.SECONDARY_SERVER_ADJ 4
setprop ro.BACKUP_APP_ADJ 5
setprop ro.HOME_APP_ADJ 6
setprop ro.HIDDEN_APP_MIN_ADJ 7
setprop ro.EMPTY_APP_ADJ 15
# Define the memory thresholds at which the above process classes will be killed. in pages (4k).
setprop ro.FOREGROUND_APP_MEM 2048
setprop ro.VISIBLE_APP_MEM 3072
setprop ro.PERCEPTIBLE_APP_MEM 4096
setprop ro.HEAVY_WEIGHT_APP_MEM 4096
setprop ro.SECONDARY_SERVER_MEM 6144
setprop ro.BACKUP_APP_MEM 6144
setprop ro.HOME_APP_MEM 6144
setprop ro.HIDDEN_APP_MEM 7168
setprop ro.EMPTY_APP_MEM 8192
=======================================================
Android中如何查看内存
(一)DDMS 的Heap Dump
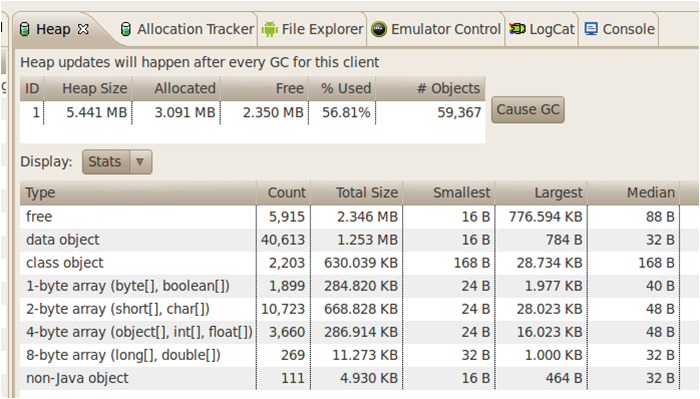
1) Data Object:java object.
2) Class Object:object of type Class, e.g. what you'd get from java.lang.String.class or myObject.getClass( ).3) 1,2,4,8-byte array:Number of bytes per entry.
1-byte array: byte, boolean
2-byte array: char, short
4-byte array: float, int
8-byte array: double, long
4) non-Java object:A non-Java Object is a piece of memory that isn't actually accessible from code written in Java. Essentially it's a blob of stuff that got stuck on the virtual heap but has no meaning to interpreted code. Shouldn't be much of that.
(二)如果你想查看所有进程的内存使用情况,可以使用"adb shell procrank"命令。 
- VSS - Virtual Set Size 虚拟耗用内存(包含共享库占用的内存)
- RSS - Resident Set Size 实际使用物理内存(包含共享库占用的内存)
- PSS - Proportional Set Size 实际使用的物理内存(比例分配共享库占用的内存)
- USS - Unique Set Size 进程独自占用的物理内存(不包含共享库占用的内存)
VSS (reported as VSZ from ps) is the total accessible address space of a process. This size also includes
memory that may not be resident in RAM like mallocs that have been allocated but not written to.
VSS is of very little use for determing real memory usage of a process.
RSS is the total memory actually held in RAM for a process. RSS can be misleading,
because it reports the total all of the shared libraries that the process uses,
even though a shared library is only loaded into memory once regardless of how many processes use it.
RSS is not an accurate representation of the memory usage for a single process.
PSS differs from RSS in that it reports the proportional size of its shared libraries,
i.e. if three processes all use a shared library that has 30 pages,
that library will only contribute 10 pages to the PSS that is reported for each of the three processes.
PSS is a very useful number because when the PSS for all processes in the system are summed together,
that is a good representation for the total memory usage in the system.
When a process is killed, the shared libraries that contributed to its PSS will be proportionally distributed to
the PSS totals for the remaining processes still using that library. In this way PSS can be slightly misleading,
because when a process is killed, PSS does not accurately represent the memory returned to the overall system.
USS is the total private memory for a process, i.e. that memory that is completely unique to that process.
USS is an extremely useful number because it indicates the true incremental cost of running a particular process.
When a process is killed, the USS is the total memory that is actually returned to the system.
(三)如果只想查看单个进程,可以使用“adb shelldumpsys meminfo”,该命令后面要加上进程的名字,以确定是哪个进程。

dalvikPrivateDirty:The private dirty pages used by dalvik。
dalvikSharedDirty : The shared dirty pages used by dalvik.
nativePrivateDirty : The private dirty pages used by the native heap .
nativePss : The proportional set size for the native heap.
nativeSharedDirty : The shared dirty pages used by the native heap.
otherPrivateDirty : The private dirty pages used by everything else.
otherPss : The proportional set size for everything else.
otherSharedDirty : The shared dirty pages used by everything else.
PrivateDirty, which is basically the amount of RAM inside the process that can not be paged to disk (it is not backed by the same data on disk),
and is not shared with any other processes.
Another way to look at PrivateDirty is the RAM that will become available to the system
when that process goes away (and probably quickly subsumed into caches and other uses of it).
In one word,Priv Dirty(Total) is Uss。
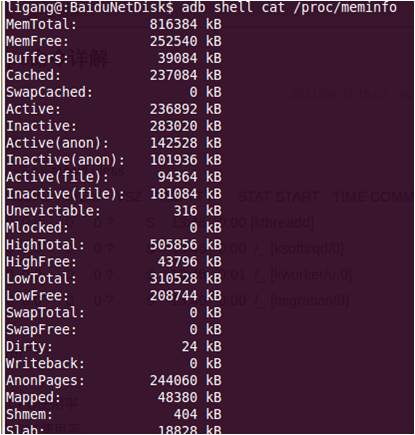
(四)使用"adb shell cat /proc/meminfo" 命令,该方式只能得出系统整个内存的大概使用情况。
(五)MAT
http://download.eclipse.org/mat/1.1/update-site/
hprof-conv src.hprof dst.hprof
Shallow Size and Retained Size
Shallow size就是对象本身占用内存的大小,不包含对其他对象的引用
Retained size是该对象自己的shallow size,加上只能从该对象直接或间接访问到对象的shallow size之和。换句话说,retained size是该对象被GC之后所能回收到内存的总和。
Shallow size of an object is the amount of memory allocated to store the object itself, not taking into account the referenced objects. Shallow size of a regular (non-array) object depends on the number and types of its fields. Shallow size of an array depends on the array length and the type of its elements (objects, primitive types). Shallow size of a set of objects represents the sum of shallow sizes of all objects in the set.
Retained size of an object is its shallow size plus the shallow sizes of the objects that are accessible, directly or indirectly,only from this object. In other words, the retained size represents the amount of memory that will be freed by the garbage collector when this object is collected.
To better understand the notion of the retained size, let us look at the following examples:
In order to measure the retained sizes, all objects in memory are treated as nodes of a graph where its edges represent references from objects to objects. There are also special nodes -GC root objects, which will not be collected byGarbage Collector at the time of measuring (read more about GC roots).
The pictures below show the same set of objects, but with varying internal references.
| Figure 1: | Figure 2: |
 |  |
Let us consider obj1.
As you can see, in both pictures we have highlighted all of the objects that are directly or indirectly accessed only byobj1. If you look at Figure 1, you will see that obj3 is not highlighted, because it is also referenced by a GC root object. On Figure 2, however, it is already included into the retained set, unlike obj5, which is still referenced by GC root.
Thus, the retained size of obj1 will represent the following respective values:
- For Figure 1: the sum of shallow sizes of obj1, obj2 and obj4
- For Figure 2: the sum of shallow sizes of obj1, obj2, obj3 andobj4
Looking at obj2, however, we see that its retained size in the above cases will be:
- For Figure 1: the sum of shallow sizes of obj2 and obj4
- For Figure 2: the sum of shallow sizes of obj2, obj3 and obj4
In general, retained size is an integral measure, which helps to understand the structure (clustering) of memory and the dependencies between object sub-graphs, as well as find potential roots of those sub-graphs.
Dominator Tree

(六)使用“adb shell ps x”命令,该方式主要得到的是内存信息是VSIZE 和RSS。由于RSS的价值不是很大,所以一般不用。
Android内存泄露的原因
- mHandler = new Handler() {
- @Override
- public void handleMessage(Message msg) {
- ....
- }
- };
相当于:
- class MyHandler implements Handler {
- ....
- }
- mHandler = new MyHandler();
类似的还有Listener,Observer,Receiver等。
由于内部类隐含拥有一个外部类对象的引用,所以千万要注意内部类instance的声明周期。
最好不要将一个内部类的instance暴漏出去,除非使用者采用weak reference引用内部类的instance。例如,一些Handler,Listener在做为返回值暴漏出去时,千万注意使用weak reference。
注意:一些系统提供的类偷偷地将自己暴漏出去了,如FileObserver,会将自己暴漏到自己内部开的线程去,不过还好它使用的是weak reference。但是过分的是BroadcastReceiver,一旦我们使用Context的registerReceiver 之后,系统( ActivityManagerNative )就会有一个它的强引用,除非我们显式调用unregisterReceiver。
结论:任何提供了开关函数的类,都必须保证显式地调用它们的开关函数。
(二) 构造Adapter时,没有使用缓存的 convertView,从而造成系统创建了大量的view而没有来得及回收。
public View getView(int position, View convertView, ViewGroup parent)(三)对于资源性对象在不使用的时候,应该调用它的close()函数,将其关闭掉,然后才置为null。资源性对象,比如(Cursor等)往往都用了一些缓冲,我们在不使用的时候,应该及时关闭它们,以便它们的缓冲及时回收内存。它们的缓冲不仅存在于java虚拟机内,还存在于java虚拟机外。如果我们仅仅是把它的引用设置为null,而不关闭它们,往往会造成内存泄露。
(四)都是线程惹的祸
- Bitmap bitmap;
- float imagew = 300; // 目标大小
- float imageh = 300; // 目标大小
- BitmapFactory.Options bitmapFactoryOptions = new BitmapFactory.Options();
- bitmapFactoryOptions.inJustDecodeBounds = true;
- bitmap = BitmapFactory.decodeFile(imageFile, bitmapFactoryOptions);
- int yRatio = (int)Math.ceil(bitmapFactoryOptions.outHeight/imageh);
- int xRatio = (int)Math.ceil(bitmapFactoryOptions.outWidth/imagew);
- if (yRatio > 1 || xRatio > 1){
- if (yRatio > xRatio) {
- bitmapFactoryOptions.inSampleSize = yRatio;
- }
- else {
- bitmapFactoryOptions.inSampleSize = xRatio;
- }
- }
- else{
- // inSampleSize = 1
- }
- bitmapFactoryOptions.inJustDecodeBounds = false;
- bitmap = BitmapFactory.decodeFile(imageFile, bitmapFactoryOptions);
- myImageView.setImageBitmap(bitmap);
- public String substring(int beginIndex, int endIndex) {
- return new String(offset + beginIndex,
- endIndex - beginIndex,
- value);
- }
- String(int offset, int count, char value[]) {
- this.value = value;
- this.offset = offset;
- this.count = count;
- }
- ArrayList<String> oomStringList = new ArrayList<String>(1024);
- for (int i=0; i<32*1024; i++) {
- String srcString = new String(new char[1024]);
- String dstString = srcString.substring(0,1);
- oomStringList .add(dstString);
- }
http://kohlerm.blogspot.com/2009/07/eclipse-memory-analyzer-10-useful.html
http://java.dzone.com/news/how-fix-memory-leaks-java
http://kohlerm.blogspot.com/search/label/memory


 1万+
1万+

 被折叠的 条评论
为什么被折叠?
被折叠的 条评论
为什么被折叠?
 到【灌水乐园】发言


