


剧情提要:
[机器小伟]在[工程师阿伟]的陪同下进入练气期第七层功法的修炼,
这次要修炼的目标是[条形统计图]。
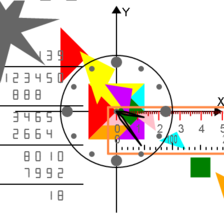
而小伟画上面的那些图是这样做的:
当然,越后面的正确性越高,因为工具是在不断改进的。
[机器小伟]在[工程师阿伟]的陪同下进入练气期第七层功法的修炼,
这次要修炼的目标是[条形统计图]。
正剧开始:
星历2016年01月26日 11:04:59, 银河系厄尔斯星球中华帝国江南行省。
[工程师阿伟]正在和[机器小伟]一起继续学习统计方面的绘图知识。
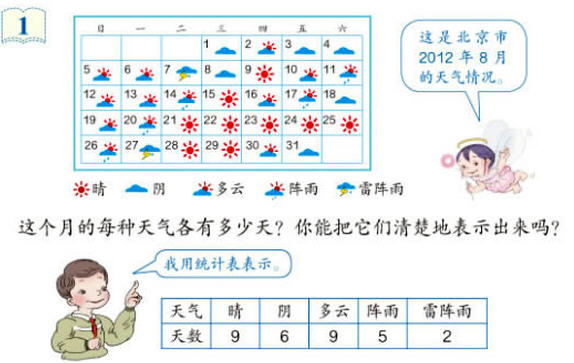
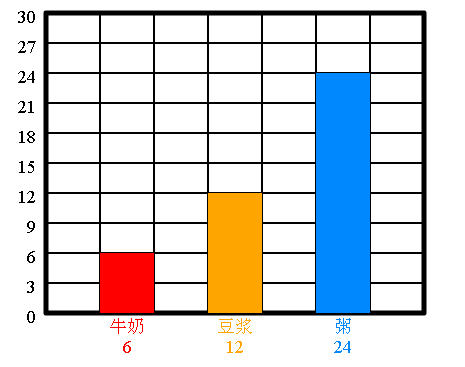
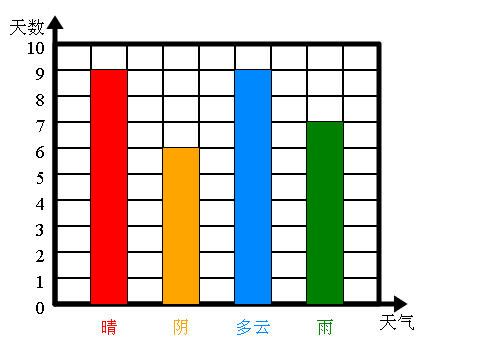
今天[人叫板老师]提出了条形统计图的概念,小伟决定要好好地画一画。
小伟说:我能,就画了这张图:


这次,小伟在左边也加上了说明的数字。
这次,小伟又加上了坐标轴。

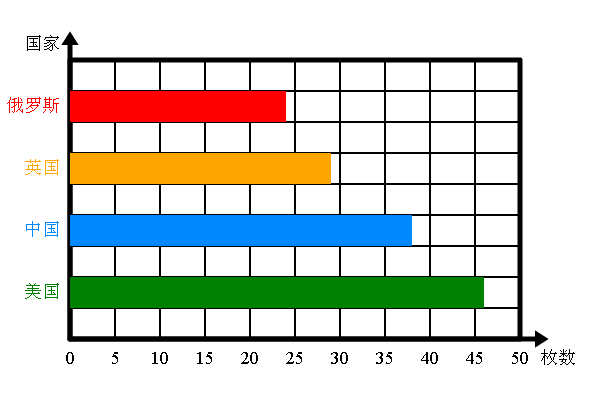
小伟又试着用另一种方向来绘制:


小伟的图已经画得和[人叫板老师]的一样了。
而这时,也已经产生了一个完整的工具:
<span style="font-size:18px;">/**
* @usage   统计类
* @author  mw
* @date    2016年01月05日  星期二  10:14:34
* @param
* @return
*
*/
function Statistic() {
	this.statisticalSample = new Array();
	this.sampleSize = 0;
	this.xLabel = '';
	this.yLabel = '';

	//初始化
	this.init = function(array, textX, textY) {
		this.statisticalSample = array;
		this.sampleSize = this.statisticalSample.length;
		this.xLabel = textX;
		this.yLabel = textY;
	}

	this.axis2D = function(x, y, rx, ry, textX, textY) {
		//原点是(x, y), rx, ry分别是x轴的长度,y轴的长度
		//textX, textY分别为x轴和y轴的标注
		plot.save();

		plot.setFillStyle('black')
			.setStrokeStyle('black');

		plot.beginPath()
			.moveTo(x,y)
			.lineTo(x+rx,y)
			.closePath()
			.stroke();

		plot.beginPath()
			.moveTo(x,y-ry)
			.lineTo(x,y)
			.closePath()
			.stroke();


		var r0 = 10;

		//x轴箭头
		plot.beginPath()
			.moveTo(x+rx- r0*Math.cos(Math.PI/3), y-r0*Math.sin(Math.PI/3))
			.lineTo(x+rx+r0*Math.sin(Math.PI/3), y)
			.lineTo(x+rx -r0*Math.cos(Math.PI/3), y+r0*Math.sin(Math.PI/3))
			.closePath()
			.fill()

		plot.setTextAlign('left')
			.fillText(textX, x+rx, y+25, 40);
		plot.setTextAlign('right')
			.fillText(textY, x-10, y-ry+10, 40);

		//y轴箭头
		plot.beginPath()
			.moveTo(x+ r0*Math.sin(Math.PI/3), y-ry+r0*Math.cos(Math.PI/3))
			.lineTo(x, y-ry-r0*Math.sin(Math.PI/3))
			.lineTo(x-r0*Math.sin(Math.PI/3), y-ry+r0*Math.cos(Math.PI/3))
			.closePath()
			.fill()

		plot.restore();
	}

	//最大值
	this.max = function() {
		var max = Number.NEGATIVE_INFINITY;
		for (var i = 0; i < this.sampleSize; i++) {

			if (max < this.statisticalSample[i]) {
				max = this.statisticalSample[i];
			}
		}
		return max;
	}

	//最小值
	this.min = function() {
		var min = Number.POSITIVE_INFINITY;
		for (var i = 0; i < this.sampleSize; i++) {
			if (min > this.statisticalSample[i]) {
				min = this.statisticalSample[i];
			}
		}
		return min;
	}

	//样本数量
	this.size = function() {
		return this.sampleSize;
	}

	//直方图
	this.histogram = function(lableArray, xOffset, yOffset) {
		lableArray = lableArray ? lableArray : [];
		var lables = lableArray.length;
		xOffset = xOffset ? xOffset : 0;
		yOffset = yOffset ? yOffset : 0;

		var colorArray = ['red', 'orange', '#0088FF', 'green', 'cyan', 'blue', '#FF00FF',
			'#888888', 'black'];
		var colors = colorArray.length;

		var height = 380, width = 580;

		plot.save()
			.translate(xOffset+60, yOffset+50);

		plot.setLineWidth(2)
			.setTextAlign('right');

		var max = Math.ceil(this.max());
		var min = Math.floor(this.min());

		var mod = 10;
		while (max % mod == 0) {
			mod *= 10;
		}

		mod /= 10;
		//最大值的末位为0的近似数,比如最大值25,最合适的近似数为30
		var adjmax = Math.ceil(max/mod)*mod;
		if (adjmax == max) {
			adjmax+=mod;
		}

		adjmax /= mod;

		var size = this.size();
		var perH = Math.round((height-100) / adjmax);
		var perW = Math.round((width-100) / (size*2+1));

		//宽和高度边界
		var wBound = (2*size+1)*perW, hBound = adjmax*perH;
		plot.setLineWidth(5)
			.strokeRect(0, 0, wBound, hBound);

		this.axis2D(0, hBound, wBound+20, hBound+20, this.xLabel, this.yLabel);

		plot.setLineWidth(2);
		var count = 0;
		for (var i = hBound; i >-1; i -= hBound / 10) {
			plot.fillText((adjmax*mod/10*count).toFixed(0), -10, i+10, 30);
			count++;

			if (i > 0) {
				plot.beginPath()
					.moveTo(0, i)
					.lineTo(wBound, i)
					.closePath()
					.stroke();
			}
		}

		for (var i = 0; i < 2*size+1; i++) {
			plot.beginPath()
				.moveTo(i*perW, 0)
				.lineTo(i*perW, hBound)
				.closePath()
				.stroke();
		}


		var xpos, xpos2;

		for (var i = 0; i < size; i++) {
			xpos = perW*(1+2*i);
			xpos2 = xpos + 0.5*perW;
			plot.setFillStyle(colorArray[i%colors]);
			plot.fillRect(perW*(1+2*i), hBound, perW, -this.statisticalSample[i]/mod*perH);

			plot.setTextAlign('center');
			if (i < lables) {
				plot.fillText(lableArray[i], xpos2,
					hBound+30, 100);

			}
			//plot.fillText(this.statisticalSample[i].toFixed(0), xpos2, hBound+40, 100);
		}


		plot.restore();

	}

	//垂直方向直方图
	this.verticalhistogram = function(lableArray, xOffset, yOffset) {
		lableArray = lableArray ? lableArray : [];
		var lables = lableArray.length;
		xOffset = xOffset ? xOffset : 0;
		yOffset = yOffset ? yOffset : 0;

		var colorArray = ['red', 'orange', '#0088FF', 'green', 'cyan', 'blue', '#FF00FF',
			'#888888', 'black'];
		var colors = colorArray.length;

		var height = 380, width = 580;

		plot.save()
			.translate(xOffset+60, yOffset+50);

		var max = Math.ceil(this.max());
		var min = Math.floor(this.min());

		var mod = 10;
		while (max % mod == 0) {
			mod *= 10;
		}
		//最大值的末位为0的近似数,比如最大值25,最合适的近似数为30
		mod /= 10;
		var adjmax = Math.ceil(max/mod)*mod;
		if (adjmax == max) {
			adjmax+=mod;
		}

		adjmax /= mod;


		var size = this.size();
		var perH = Math.round((height-100) / (size*2+1));
		var perW = Math.round((width-100) / adjmax);

		//宽和高度边界
		var hBound = (2*size+1)*perH, wBound = adjmax*perW;
		plot.setLineWidth(5)
			.strokeRect(0, 0, wBound, hBound);

		this.axis2D(0, hBound, wBound+20, hBound+20, this.xLabel, this.yLabel);

		plot.setLineWidth(2)
			.setTextAlign('center');
		var count = 0;
		for (var i = 0; i < wBound+1; i += wBound / 10) {
			plot.fillText((adjmax*mod/10*count).toFixed(0), i, hBound+25, 30);
			count++;

			if (i > 0) {
				plot.beginPath()
					.moveTo(i, 0)
					.lineTo(i, hBound)
					.closePath()
					.stroke();
			}
		}

		for (var i = 0; i < 2*size+1; i++) {
			plot.beginPath()
				.moveTo(0, i*perH)
				.lineTo(wBound, i*perH)
				.closePath()
				.stroke();
		}


		var ypos, ypos2;

		for (var i = 0; i < size; i++) {
			ypos = perH*(1+2*i);
			ypos2 = ypos + 0.5*perH+5;
			plot.setFillStyle(colorArray[i%colors]);
			plot.fillRect(0, ypos, this.statisticalSample[i]/mod*perW, perH);

			plot.setTextAlign('right');
			if (i < lables) {
				plot.fillText(lableArray[i], -10, ypos2, 100);

			}

		}


		plot.restore();

	}
}</span>
而小伟画上面的那些图是这样做的:
<span style="font-size:18px;">function myDraw() {
var config = new PlotConfiguration();
config.init();
config.setPreference();
//config.setSector(1,1,1,1);
//config.axis2D(0, 0, 180);
var stat = new Statistic();
var data = [9,6,9,7];
var text = ['晴', '阴', '多云', '雨'];
var textX = '天气',textY = '天数';
stat.init(data, textX, textY);
stat.histogram(text, 20, 50);
}
function myDraw() {
var config = new PlotConfiguration();
config.init();
config.setPreference();
//config.setSector(1,1,1,1);
//config.axis2D(0, 0, 180);
var stat = new Statistic();
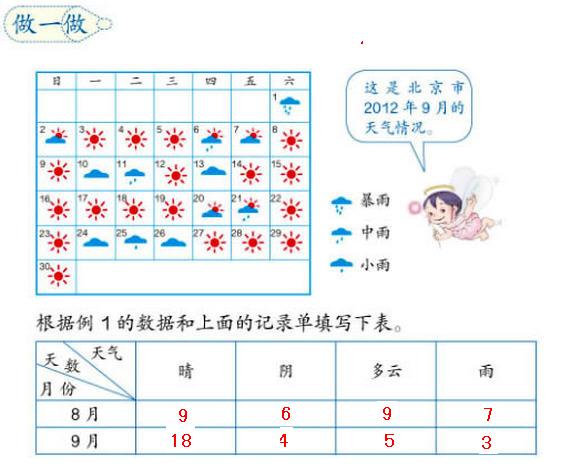
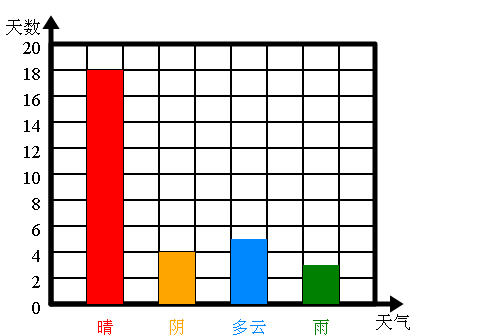
var data = [18,4,5,3];
var text = ['晴', '阴', '多云', '雨'];
var textX = '天气',textY = '天数';
stat.init(data, textX, textY);
stat.histogram(text, 20, 50);
}
function myDraw() {
var config = new PlotConfiguration();
config.init();
config.setPreference();
//config.setSector(1,1,1,1);
//config.axis2D(0, 0, 180);
var stat = new Statistic();
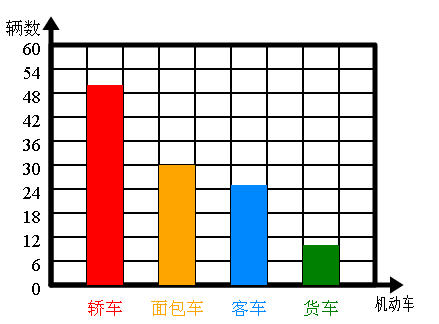
var data = [50, 30, 25,10];
var text = ['轿车', '面包车', '客车', '货车'];
var textX = '机动车',textY = '辆数';
stat.init(data, textX, textY);
stat.histogram(text, 20, 50);
}
function myDraw() {
var config = new PlotConfiguration();
config.init();
config.setPreference();
//config.setSector(1,1,1,1);
//config.axis2D(0, 0, 180);
var stat = new Statistic();
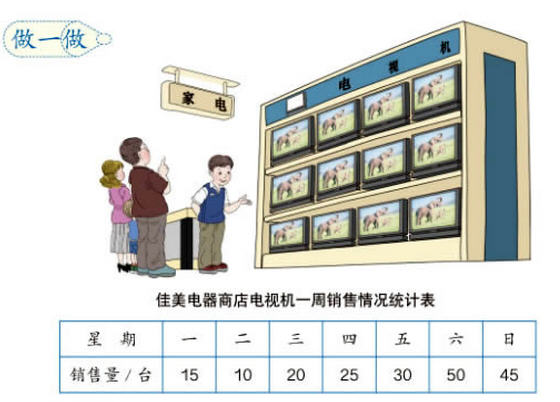
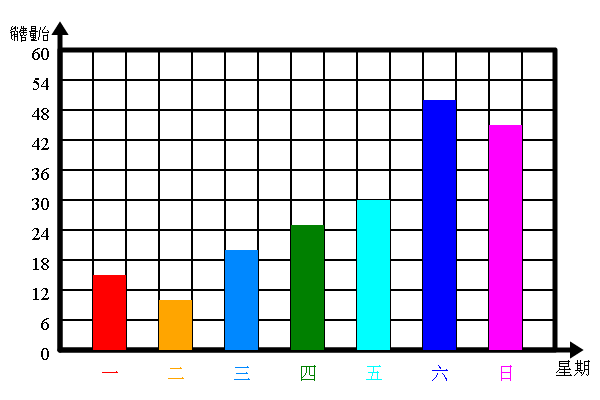
var data = [15,10,20,25,30,50,45];
var text = ['一', '二', '三', '四', '五', '六', '日'];
var textX = '星期',textY = '销售量/台';
stat.init(data, textX, textY);
stat.histogram(text, 0, 0);
}
function myDraw() {
var config = new PlotConfiguration();
config.init();
config.setPreference();
//config.setSector(1,1,1,1);
//config.axis2D(0, 0, 180);
var stat = new Statistic();
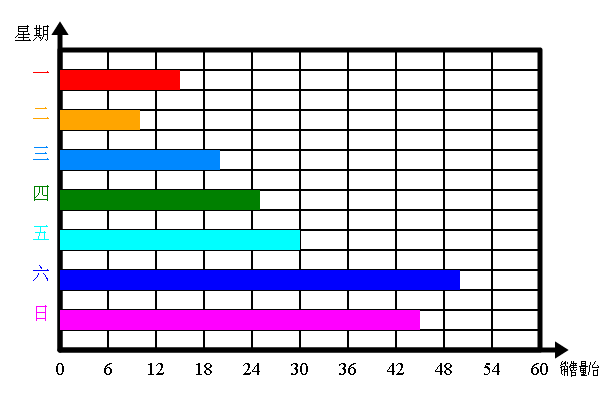
var data = [15,10,20,25,30,50,45];
var text = ['一', '二', '三', '四', '五', '六', '日'];
var textX = '星期',textY = '销售量/台';
stat.init(data, textX, textY);
stat.verticalhistogram(text, 0, 0);
}
function myDraw() {
var config = new PlotConfiguration();
config.init();
config.setPreference();
//config.setSector(1,1,1,1);
//config.axis2D(0, 0, 180);
var stat = new Statistic();
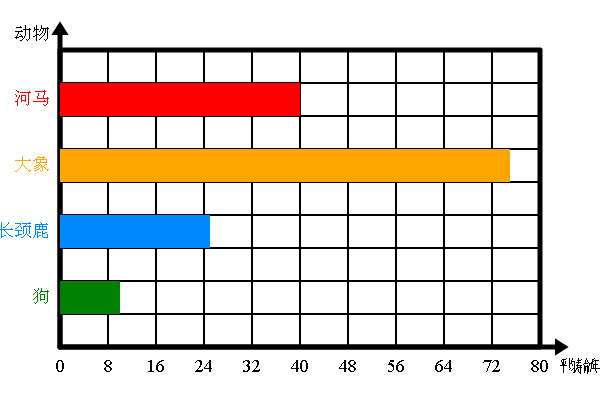
var data = [40,75,25,10];
var text = ['河马', '大象', '长颈鹿', '狗'];
var textX = '平均寿命/年',textY = '动物';
stat.init(data, textX, textY);
stat.verticalhistogram(text, 0, 0);
}
function myDraw() {
var config = new PlotConfiguration();
config.init();
config.setPreference();
//config.setSector(1,1,1,1);
//config.axis2D(0, 0, 180);
var stat = new Statistic();
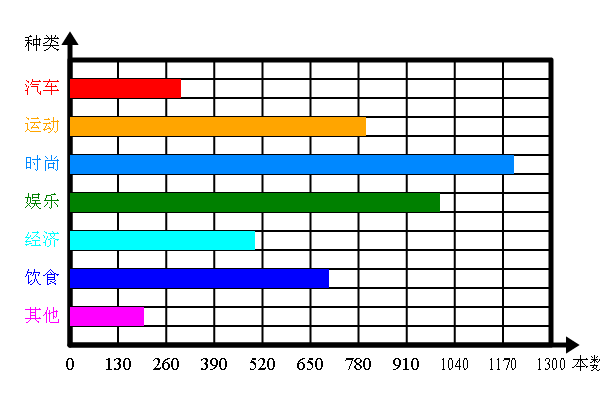
var data = [300,800,1200,1000,500,700,200];
var text = ['汽车', '运动', '时尚', '娱乐', '经济', '饮食', '其他'];
var textX = '本数',textY = '种类';
stat.init(data, textX, textY);
stat.verticalhistogram(text, 10, 10);
}
function myDraw() {
var config = new PlotConfiguration();
config.init();
config.setPreference();
//config.setSector(1,1,1,1);
//config.axis2D(0, 0, 180);
var stat = new Statistic();
var data = [300,800,1200,1000,500,700,200];
var text = ['汽车', '运动', '时尚', '娱乐', '经济', '饮食', '其他'];
var textX = '种类',textY = '本数';
stat.init(data, textX, textY);
stat.histogram(text, 0, 0);
}</span>当然,越后面的正确性越高,因为工具是在不断改进的。
本节到此结束,欲知后事如何,请看下回分解。


 被折叠的 条评论
为什么被折叠?
被折叠的 条评论
为什么被折叠?
 到【灌水乐园】发言


