导读
作者:周晓,知数堂第8期学员
曾在TP-LINK任Oracle DBA和系统运维工作,目前在六度人和科技做MySQL DBA,主导多次与数据库相关的项目重构与设计、数据无停服迁移,帮助开发优化了大量SQL并组织培训,网络常用id: seanlook。
微信号:zhouxiao_zx77
博客:seanlook.com
本文用实例来分析MySQL阻塞—线程statistics状态。
一、 现象
某日下午下班后低峰期,现网MySQL一个库突然报出大量慢sql,状态是 statistics,但是过后拿这些sql去执行的时候,实际很快。处于 statistics 状态的线程有个特征:查询的都是视图,但看监控那个时间段并没有明显的update/detele/insert。
通过我们的快照程序,去分析当时的 innodb status,发现如下信息:
SEMAPHORES
----------
OS WAIT ARRAY INFO: reservation count 17208994
--Thread 139964610234112 has waited at srv0srv.cc line 2132 for 14.00 seconds the semaphore:
X-lock (wait_ex) on RW-latch at 0x1635a00 created in file dict0dict.cc line 900
a writer (thread id 139964610234112) has reserved it in mode wait exclusive
number of readers 1, waiters flag 0, lock_word: ffffffffffffffff
Last time read locked in file row0purge.cc line 720
Last time write locked in file /home/admin/146_20161018140650857_13830810_code/rpm_workspace/storage/innobase/srv/srv0srv.cc line 2132
OS WAIT ARRAY INFO: signal count 256984450
Mutex spin waits 626367674, rounds 2776951802, OS waits 1973672
RW-shared spins 149944457, rounds 1650148561, OS waits 3972058
RW-excl spins 72090467, rounds 2017802579, OS waits 11148264
Spin rounds per wait: 4.43 mutex, 11.01 RW-shared, 27.99 RW-excl
...
FILE I/O
--------
I/O thread 0 state: waiting for i/o request (insert buffer thread)
I/O thread 1 state: waiting for i/o request (log thread)
I/O thread 2 state: waiting for i/o request (read thread)
I/O thread 3 state: doing file i/o (read thread) ev set
I/O thread 4 state: waiting for i/o request (read thread)
I/O thread 5 state: doing file i/o (read thread) ev set
I/O thread 6 state: doing file i/o (write thread) ev set
I/O thread 7 state: waiting for i/o request (write thread)
I/O thread 8 state: waiting for i/o request (write thread)
I/O thread 9 state: waiting for i/o request (write thread)
Pending normal aio reads: 18 [0, 12, 0, 6] , aio writes: 1 [1, 0, 0, 0] ,
ibuf aio reads: 0, log i/o's: 0, sync i/o's: 0
Pending flushes (fsync) log: 0; buffer pool: 0
1346747614 OS file reads, 2869418806 OS file writes, 524616747 OS fsyncs
22 pending preads, 1 pending pwrites
6.00 reads/s, 16384 avg bytes/read, 0.00 writes/s, 0.00 fsyncs/s
...
ROW OPERATIONS
--------------
0 queries inside InnoDB, 0 queries in queue
38 read views open inside InnoDB
Main thread process no. 34414, id 139964610234112, state: enforcing dict cache limit
Number of rows inserted 2546811699, updated 1708150459, deleted 1004154696, read 413168628410
0.00 inserts/s, 0.00 updates/s, 0.00 deletes/s, 54.19 reads/s
二、 分析
从上面的信息知道 Thread 139964610234112 是主线程,在源码 srv0srv.cc:2132 行的地方等待信号14s,这个信号是在 dict0dict.cc:900 地方创建的 RW-latch 排它锁。那么奇怪了,主线程自己在等待自己的互斥锁。
由于环境是阿里云的RDS(基于MySQL 5.6.16-log 版本),拿不到他们的代码,找来 5.6.35 的来看,行号对不上。但好在上段信息的最后面有一个 Main thread state: enforcing dict cache limit,发现在 srv0srv.cc 函数 srv_master_do_active_tasks() 约2137行的位置:
if (cur_time % SRV_MASTER_DICT_LRU_INTERVAL == 0) {
        srv_main_thread_op_info = "enforcing dict cache limit";
        srv_master_evict_from_table_cache(50);
        MONITOR_INC_TIME_IN_MICRO_SECS(
            MONITOR_SRV_DICT_LRU_MICROSECOND, counter_time);
    }
应该是在调用 srv_master_evict_from_table_cache() 从innodb table cache里面清理缓存的地方waiting(这里不是一定会清理,而是先判断空间够不够用,参数50表示只扫描 unused_table list的50%)。srv_master_evict_from_table_cache():
srv_master_evict_from_table_cache(
/*==============================*/
    ulint    pct_check)    /*!< in: max percent to check */
{
    ulint    n_tables_evicted = 0;

    rw_lock_x_lock(&dict_operation_lock);

    dict_mutex_enter_for_mysql();

    n_tables_evicted = dict_make_room_in_cache(  /** 在dict0dict.cc里面 **/
        innobase_get_table_cache_size(), pct_check);

    dict_mutex_exit_for_mysql();

    rw_lock_x_unlock(&dict_operation_lock);

    return(n_tables_evicted);
}
就是在 rw_lock_x_lock(&dict_operation_lock) 这个地方获取Latch的时候等待了14s,这个锁就是在数据字典模块 dict0dict.cc:dict_init() 约1065行的地方创建的,与innodb status输出基本一致。
关于 dict_operation_lock 直接看注释吧:
/** @brief the data dictionary rw-latch protecting dict_sys
table create, drop, etc. reserve this in X-mode;
implicit or backround operations purge, rollback, foreign key checks reserve this in S-mode;
we cannot trust that MySQL protects implicit or background operations a table drop since MySQL does not know of them;
therefore we need this; NOTE: a transaction which reserves this must keep book on the mode in trx_t::dict_operation_lock_mode */
在尝试把表定义逐出缓存时,获取的是 dict_operation_lock X-mode lock,可是从已有的信息里看不到另一个数据字典锁是什么。 之前是怀疑是不是 table_definition_cache, table_open_cache, innodb_open_files 设置小了,视图一般是多表join,更容易消耗打开表的数量,导致不断的逐出cache而导致锁争用。但是检查一番并没发现什么问题,更何况是14s的等待。关于它们的设置和关系,可以参考我的文章 table_open_cache 与 table_definition_cache 对MySQL的影响(详见文末参考文献)。
那么得换个思路了,processlist里面有13个长时间处于 statistics 状态的线程,表示正在计算统计数据,以制定一个查询执行计划。 如果一个线程很长一段时间处于这种状态,可能是磁盘IO性能很差,或者磁盘在执行其他工作。
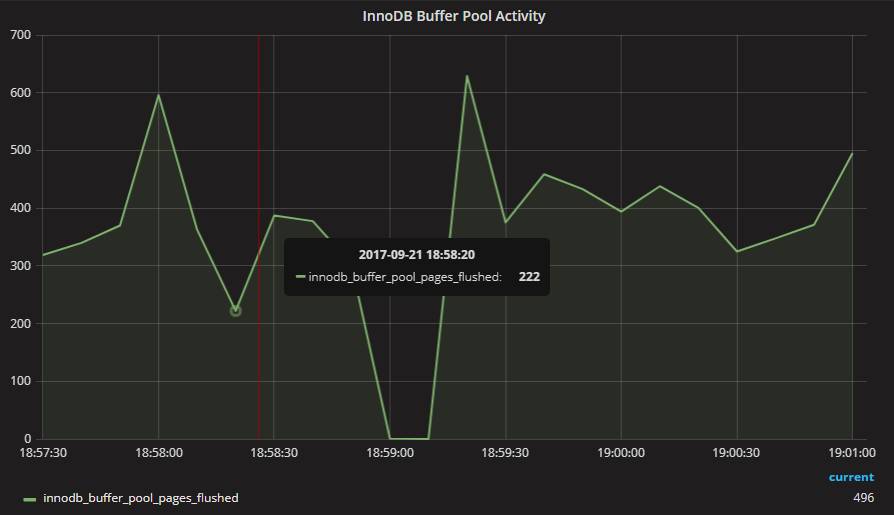
此时注意到最上面的信息里有 Pending normal aio reads: 18 [0, 12, 0, 6] ,有18个读IO被挂起(实际从监控图 innodb_data_pending_reads看来,有达到过50),四个read thread有三个处于忙碌状态。再有 innodb_buffer_pool_pages_flushed 在出异常前10s没有任何变化,也就是没有成功的将脏数据刷盘动作。另外这是一个从库,出异常前10s有出现过瞬间20多秒延迟:
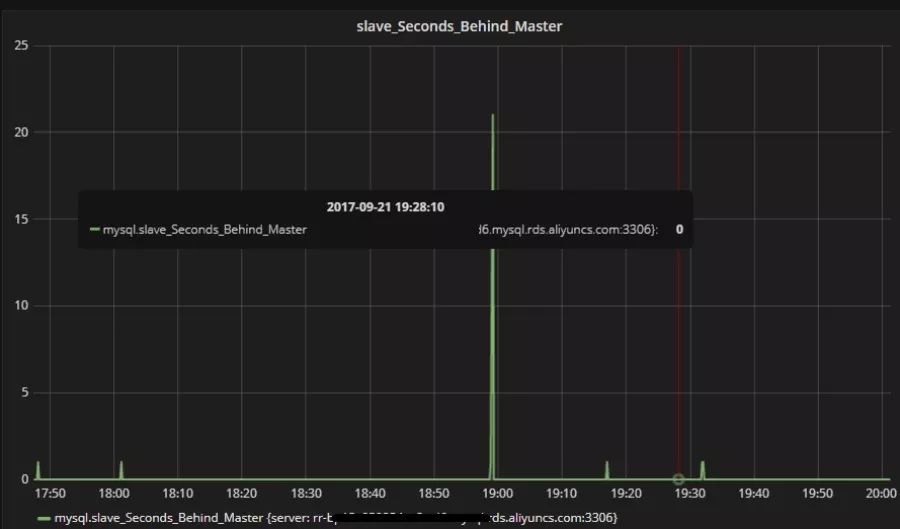
(这一切关注的都是 18:59:05 之前的数据,之后的时间,一般恢复了都会有瞬间的读行数上涨,这个时候别把它们反当做起因)
三、结论
结合上面的 enforcing dict cache limit 和 statistics IO pending,找到两个有关的bug report:
第一个是使用 pt-online-schema-change 去更改分区表的结构,可能会出现,但目前bug状态是Undecided,我们的环境没有分区表,没外键,也没有改表动作。 第二个其实 Not a bug:
Thank you for your bug report. This is, however, not a bug, but a very well known issue.
You have to do several things in order to alleviate the problem:
* increase the additional memory pool
(注:这里我认为不应该是additional memory pool,而是 buffer_pool,因为现在innodb内存管理基本是调用系统malloc,即innodb_use_sys_malloc=ON,参考https://dev.mysql.com/doc/refman/5.7/en/innodb-performance-use_sys_malloc.html)
* increase total number of file handles available to MySQL
* increase number of file handles for InnoDB
* improve performance of the I/O on your operating system
说到底就是数据库服务器IO遇到问题了,可以通过增加 buffer_pool 来缓存更多的数据,或者提高服务器IO能力,这个范围就广了,可参考《8.5.8 Optimizing InnoDB Disk I/O》(详见文末参考文献)。 然而生产服务器都运行了1年之久,高峰期都没出现过IO问题,现在何况低峰期,也没有人为操作。那这个锅只能交给阿里RDS了:怀疑是实例所在物理机磁盘有抖动。
分析这么久得出这个结论,却不能做什么,因为我们没办法看到服务器级别的IO stats。其实想到去年也有实例出现过几例类似 statistics 问题,向阿里云提工单确认物理机状态,得到的结论都是:“是的,物理机有抖动。需要申请迁移实例吗”,但是从来拿不到依据。如果自己能看到OS级别的监控,其实都不需要本文这么冗长的分析。
参考文献:(选择复制以下链接,点击“打开”就可以阅读相关文章)
1、《statistics State in MySQL Processlist》,链接:
https://dba.stackexchange.com/questions/55969/statistics-state-in-mysql-processlist
2、《List of background operations performed by MySQL InnoDB Main thread》,链接:
http://mysqlinternals.blogspot.com/2015/05/list-of-background-operations-performed.html
3、《processlist中哪些状态要引起关注》,链接:
http://imysql.com/2015/06/10/mysql-faq-processlist-thread-states.shtml
4、《是什么导致MySQL数据库服务器磁盘I/O高?》,链接:
http://imysql.com/2016/11/20/mysql-faq-what-cause-diskio-so-high.shtml
5、《table_open_cache 与 table_definition_cache 对MySQL(内存)的影响》,链接:
http://seanlook.com/2017/10/13/mysql-table_open_cache_file_limits
6、《8.5.8 Optimizing InnoDB Disk I/O》,链接:
https://dev.mysql.com/doc/refman/5.6/en/optimizing-innodb-diskio.html


扫码加入知数堂技术交流QQ群
(群号:579036588)
群内可@各位助教了解更多课程信息


知数堂
叶金荣与吴炳锡联合打造
领跑IT精英培训
行业资深专家强强联合,倾心定制
MySQL实战/MySQL优化 / Python/ SQL优化
数门精品课程
紧随技术发展趋势,定期优化培训教案
融入大量生产案例,贴合企业一线需求
社群陪伴学习,一次报名,可学3期
DBA、开发工程师必修课
上千位学员已华丽转身,薪资翻番,职位提升
改变已悄然发生,你还在等什么?

扫码下载知数堂精品课程试听视频
或点击“阅读原文”直达下载地址
(MySQL 实战/优化、Python开发,及SQL优化等课程)
密码:hg3h


 561
561


 被折叠的 条评论
为什么被折叠?
被折叠的 条评论
为什么被折叠?
 到【灌水乐园】发言


