


在性能测试中,我们经常需要画出CPU memory 或者IO的趋势图。估计大学里,大多数人都学习过matlib, 领略了matlib画图的强大。 python提供了强大的画图模块matplotlib,完全按照matlib的库来的,移步到官方网站看看http://matplotlib.org/。
绘制性能测试中CPU, memory, IO的趋势图,不需要很多复杂的功能,就是个2D图。 直接看代码吧,直接!需要的读者,可以直接下载这个代码用就好了,兼容了CPU/Memory/IO, 或者多个进程的情况,文件名为draw_trend.py, 用法,draw_trend.py data_file cpu/mem/io, 读者需要做的只是把监控的数据按代码后面的格式处理出来。
#!/usr/bin/env python
#coding=utf-8

import matplotlib as mpl
mpl.use('Agg')
import matplotlib.pyplot as plt
import datetime as dt
from matplotlib.font_manager import FontProperties
import sys

def draw_trend(data_file,object_type):
    fontP = FontProperties()
    fontP.set_size('small')
    data=open(data_file,"r")
    lines=data.readlines()
    data.close()
    lable_list=lines[0].split(None)
    #data={"lable_name":[x,y1,y2],x:[1,2,4],y1:[2,4],y3:[4,5]}
    lable_name=[]
    data_list=[]

    for lable in lable_list:
        lable_name.append(lable)
        data_list.append([])

    for line in lines[1:]:
        line_list=line.strip().split(None)
        #print line_list
        #print data_list
        for i in xrange(len(data_list)):
            #print data_list
            if i==0:
                data_list[0].append(dt.datetime(int(line_list[0][0:4]), int(line_list[0][4:6]),
                    int(line_list[0][6:8]),int(line_list[0][9:11]),
                    int(line_list[0][12:14]),int(line_list[0][15:17])))
            else:
                if object_type=="mem":
                    data_list[i].append(float(line_list[i]))
                else:
                    data_list[i].append(float(line_list[i]))
    #print data_list
    '''
    dates = [dt.datetime.today() + dt.timedelta(days=i) for i in range(10)]
    values = np.random.rand(len(dates))
    '''
    mpl_date2num=mpl.dates.date2num(data_list[0])
    for y_value in data_list[1:]:
        plt.plot_date(mpl_date2num, y_value,"-",label=lable_name[data_list.index(y_value)])
    xAxis = plt.axes().xaxis
    dateFmt = mpl.dates.DateFormatter('%H:%M')
    #daysLoc = mpl.dates.DayLocator()
    #minLoca=mpl.dates.MinuteLocator(interval=2)
    #secLoc=mpl.dates.SecondLocator(interval=60)
    xAxis.set_major_formatter(dateFmt)
    #xAxis.set_major_locator(minLoca)
    #xAxis.set_minor_locator(secLoc)

    #plt.legend(loc='upper right',bbox_to_anchor=(1.0, 1.07),prop = fontP,ncol=len(lable_name)-1)
    #leg=plt.legend(loc='upper right',prop = fontP)
    leg=plt.legend(loc='upper right',prop={'size':8})
    leg.get_frame().set_alpha(0.5)
    plt.tick_params(axis='both', labelsize=8)
    plt.xlabel('Time')
    if object_type=="mem":
        plt.ylabel('Memory/unit M')
    if  object_type=="io":
        plt.ylabel('IO Busy')
    if  object_type=="cpu":
        plt.ylabel('CPU Usage Percent')
    plt.savefig(data_file+".png")

    #plt.show()
try:
    draw_trend(sys.argv[1],sys.argv[2])
except:
    print "error command, right command should be:","python draw_matlab.py datafile  mem/io/cpu"
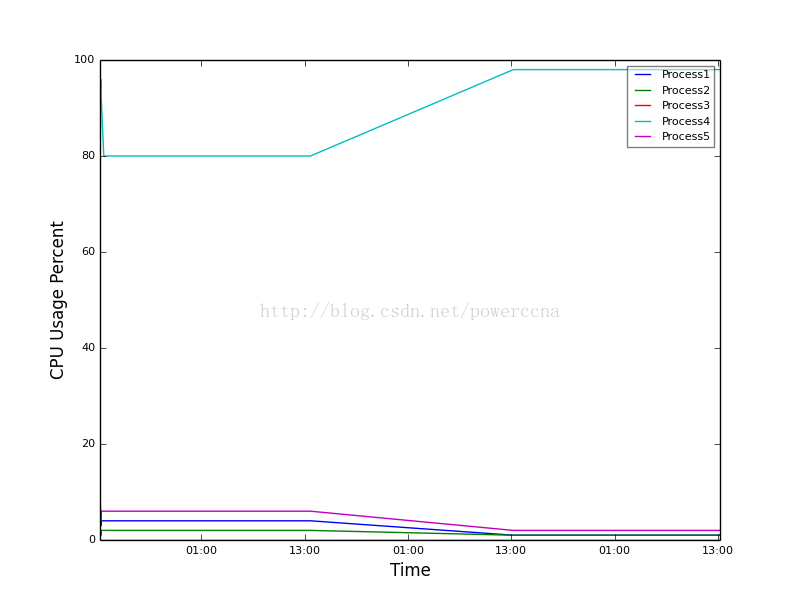
数据要求的格式为,第一行为 X轴标题,和对应画图对象,每个对象空格隔开。看下面数据
time Process1 Process2 Process3 Process4 Process5
20120410-13:13:47 1 1 0 80 2
20120410-13:13:53 0 0 0 81 0
20120410-13:13:59 4 2 0 82 6
20120410-13:14:05 4 2 0 83 6
20120410-13:14:11 5 3 0 84 8
20120410-13:14:17 5 3 0 85 8
20120410-13:14:23 5 2 0 93 7
20120410-13:14:29 5 2 0 93 7
20120410-13:14:35 4 2 0 94 6
20120410-13:14:41 5 3 0 92 8
20120410-13:14:47 4 3 0 93 7
20120410-13:14:53 4 2 0 94 6
20120410-13:14:59 4 2 0 94 6
20120410-13:15:05 3 2 0 95 5
20120410-13:15:11 4 2 0 94 6
20120410-13:15:17 4 2 0 94 6
20120410-13:15:23 4 1 0 95 5
20120410-13:15:29 5 1 0 94 6


 806
806


 被折叠的 条评论
为什么被折叠?
被折叠的 条评论
为什么被折叠?
 到【灌水乐园】发言


