


A strong A/B testing plan will allow you to increase your revenue. You will also learn valuable insights about your customers, because you will know their preferences instead of guessing what your customer may want.
A/B testing produces concrete evidence of what actually works in your marketing. Continuously testing your hypotheses will not only yield good results for conversion rates, but will also give you a better understanding of your customers. Having a clear idea of what your customers actually like and prefer can do wonders for your branding and marketing in other channels as well.
In its core, A/B testing belongs to a category of Scientific Optimization techniques, where statistics is used to increase the odds that your site visitors will see the best-performing version.
By levels of sophistication, scientific optimization can be broken down into three categories:
- A/B Split Testing – Simple testing of a page’s one element against another to see which element results in better performance.
- Multivariate Testing – Testing several elements at a time. The goal is to get an idea of which elements work together on a page and play the biggest role in achieving the objective.
- Experimental Design – Developing your own research method for an in-depth analysis of a specific element.
This post is about A/B testing, since this technique produces the fastest gains and has lower chances of error through misuse. But we will also delve into the differences between A/B testing and Multivariate testing.
Let’s start from a clear definition of what A/B testing actually is:
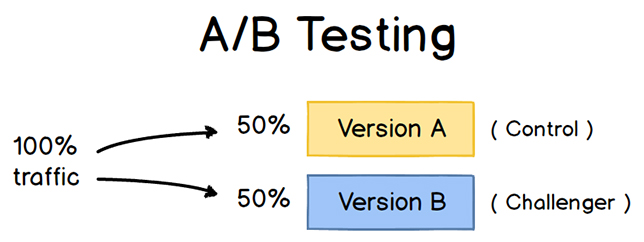
A/B testing, or split testing, is a process where we are running a simultaneous experiment between two pages to see which performs better. It is a method for validating that any new addition or change to your webpage will actually improve it’s conversion rate. An A/B test consists of creating alternative pages for a specific page, showing each of them to a predetermined percentage of visitors. In a classic A/B test, we test two versions – Version A is commonly the existing design (the “control”) and version B is the “challenger”.
An A/B test is the easiest and most common type of landing page test to conduct. Testing is also done between several versions of a page (A/B/C/D testing), but often still called A/B testing.
This is how the process works:
A/B tests are often used to experiment with page design options that vary dramatically, including position of text and pictures, background colors, number of pictures on the page, use of icons and navigation structure. The tests usually involve fewer combinations with more extreme changes.
A/B testing should be a part of a structured approach for improving your conversion rates.In a survey done by Econsultancy and RedEye, 74% of the survey respondents who reported having a structured approach to conversion also stated they had improved their sales.
A structured A/B split testing process for better conversion rates
A/B testing is a part of a wider, holistic conversion rate optimization process and should always be viewed as such. Doing A/B testing without thinking about your online goals and user behavior in general will lead to ineffective testing. When done correctly, you can achieve good, measurable results in a short timeframe.
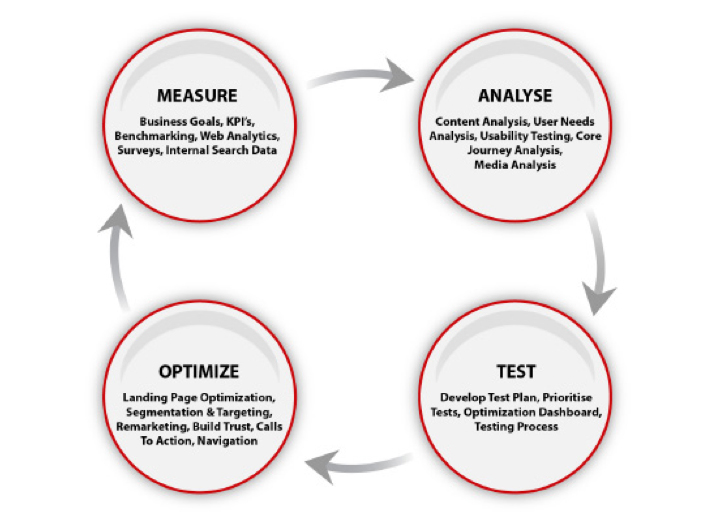
A structured approach to improving your conversion rates needs to be a continuous process of improvement. It is a cycle of Measurement, Prioritization, and Testing. Each of these stages of the cycle have a goal and a purpose, leading to the next stage. So for your A/B testing to be successful, we will have to start from the beginning.
Step 1) Measure your website’s performance

To continually improve your conversion rates, start by properly measuring your website’s performance. We want to know what is happening and why it’s happening.
What is happening: Make sure you are getting actionable data from Google Analytics
1) Define your business objectives
This is the answer to the question: “Why does your website exist?” Make your objectives DUMB – Doable, Understandable, Manageable, Beneficial. Companies often fail in web analytics because their objectives are not simple to understand or measure.
Example: A business objective for an online flower store is to “Increase our sales by receiving online orders for our bouquets.”
2) Define your website goals
Goals come from your business objectives and are mostly strategic in nature. So if we were to continue with the business objective example of increasing our bouquet sales, we would have to:
1) Do x – Add better product images
2) Increase y – Increase clickthrough rates
3) Reduce z – Reduce our shopping cart abandonment rate
Goals are your priorities, expressed as simply as possible. Before you start working on your data, make sure you have them defined and properly set up in Google Analytics.
3) Define your Key Performance Indicators
KPIs are metrics (numbers).
“A key performance indicator (KPI) is a metric that helps you understand how you are doing against your objectives.” – Avinash Kaushik
A metric becomes a KPI only when it is measuring something connected to your objectives.
Example: Our flower store’s business objective is to sell bouquets. Our KPI could be number of bouquets sold online.
This is the reason why you need to have your business objectives clearly defined – without them, you will be unable to identify your KPI’s. If you have proper KPIs and look at them periodically, you will keep your strategy on track.
4) Define your target metrics
Our flower store sold 57 bouquets last month. Is that good? Or devastatingly bad? For your KPIs to mean something for you, they need target metrics. Define a target for every KPI that is important to you. For our imaginary flower store, we can define a monthly target of 175 bouquets sold.
![]()
Now you have a framework which will help you insure that the work you will be doing is relevant to your business goals.
Why is it happening: Talk to your visitors
Getting real feedback from your visitors is invaluable. Use surveys to discover your visitors’ objectives. Set up entry surveys to find out why they are visiting your site and exit surveys to find out if their goals were fulfilled.
You can find what is happening on your site by using Google Analytics – What features they use, where they exit and who is profitable. But Analytics doesn’t tell you the whybehind this. This is where qualitative data comes in. Qualitative data is perfect for finding out why problems occur.
The best way to get qualitative data from your visitors is through surveys. Your goal is to find out why visitors buy and why they leave without purchasing.

Here are some ideas for gathering qualitative data:
- Add an exit survey on your site, asking why your visitors didnt complete the goal of the site
- Add an exit survey on your thank-you pages for finding out why your visitors converted
- Perform usability testing with members of your target group
- Send out a feedback surveys to your clients to find out more about them and their motives
If a large amount of people click on your e-book ad, but only a few people actually buy after seeing the price, you will want to dig deeper into the problem. In this example, you could put up a survey, asking people if they have any questions that the page doesn’t answer. You can also survey people who have already bought your book, to see what made them buy.
To find out what could bring the biggest gains, look for trends in your customer feedback
You will start noticing trends in people’s responses after you’ve collected over 50 of them. Often times, we find that the site hasn’t addressed an important objection of your client. The main take-away is, that qualitative data will help you understand which elements will have the highest impact when running an A/B test.
Think about how you could spot emerging trends with your customer feedback. When something pops up, you can dive deeper to find out exactly what is going on.
Use segmentation to get actionable data
The problem with using site averages in your testing is that you are missing out on what is going on inside the average (the segments).
An experiment that seemed to be performing poorly might have actually been successful, but only for a certain segment. For example, our experiment may have shown that a variation of our mobile landing page is not performing well. When looking into the segments though, we may see that it is performing exceptionally well for Android users, but badly for iPhone users. When not looking at segments, you can miss this detail.
Never report a metric (even the most hyped or your favorite KPI) without segmenting it a few levels deep. That is the only way to get deep insights into what that metric is really hiding or to see what valuable information you can use.” – Avinash Kaushik
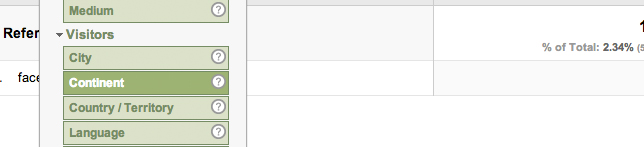
To understand segments, we need to understand dimensions. A dimension is any attribute of a visitor to your website. A dimension can be a source where they came from (a country, URL, etc.) , technical information like the browser they are using or their activity on the site (pages they looked at, images they opened). A segment is made up of a group of rows from one or more dimensions.
By default, a lot of the data you get is useless in reality. The number of visits to your site doesnt really give you any actionable information. To get actionable data for testing, you need to segment the data you have, using dimensions. You can also split test for single segments of your traffic, which is a part of Behavioural targeting.
Three good segmentation strategies to focus on
Avinash Kaushik has outlined a simple strategy for segmenting your traffic. Best ideas for taking action come from segmentation.
Segment by source – Separate people who arrive on your website from e-mail campaigns, google, twitter, youtube, etc. Find answers to questions like: Is there a difference between bounce rates for those segments? Is there a difference in Visitor Loyalty between those who came from Youtube versus those who came from Twitter? What products do people who come from Youtube care about more than people who come from Google?
Segment by behavior – Different groups of people behave differently on a website, because they have different needs or goals. For example, on an e-commerce store, you can separate out people who visit more than ten times a month versus those that visit only twice. Do these people look for products in different price ranges? Are they from different regions?
Segment by outcome – Separate people out by the products they purchase, by order size, by people who have signed up, etc. Focus on groups of people who have delivered similar outcomes and ask questions like the ones above.
When you have found your most profitable segments, you can keep them in mind when doing split testing. It’s good to know who your most profitable visitors are, before you start split testing.
Step 2) Prioritize your testing opportunities

Once you have your metrics in place and you know your goals, the next step is to prioritize what to test. Essentially, you could test anything, but everyone needs a place to start from. Google Analytics will give you a lot of data, but often it makes sense to start from split testing opportunities that promise the biggest gains.
Prioritize tests based on data – it will be your most valuable resource for prioritizing your tests.
Your homepage may not be the most important area of your site
See your “top landing pages” report from Google Analytics – You will likely see many different pages getting entrances, some even more than your home page.
Look at data on a page template level
When you add together the traffic from all of your pages that use the same template, you may see that they get a lot more traffic than your homepage. Do this when you need to determine opportunities for testing site-wide template layouts.
Prioritize pages with high potential for improvement
Look for pages that are not performing well. Your Analytics data can show some clearly problematic pages, like landing pages with high bounce rates, but some other areas may not be so obvious. If your problem is a high shopping-cart abandonment rate in the checkout process, Google Analytics will not be able to tell you that your visitors are finding it difficult to find shipping information from other pages, so they will go to the checkout process just to see that information. If you only work on optimizing your shopping cart views, you may not be able to fix the problem – you need to be also looking at your product and category pages.
When looked at separately, none of your information sources will perfectly identify split testing opportunities. You need to look at several pages together.
Top exit pages – This is the last page that someone sees before leaving your site. Labeled “% Exit” in Google Analytics, it will show you the percentage of visitors who leave your site immediately after viewing the page. Top exit-rate pages can identify problem areas.
A conversion funnel consists of two parts: The persuasive end (top of the funnel) and the transactional end (bottom of the funnel). The persuasive end includes the most-viewed areas of you site like your homepage, category pages, product pages. These are the areas of your site where you are getting the visitor interested in your product or service. The bottom end of your funnel is where conversion happens – Visitors buy the product, sign up or contact you. Most of the data we have looked at so far has been focused on the persuasive end of the funnel, but we also need to look at the bottom of the funnel.
Look at funnel drop-off rates

A funnel in Google Analytics focuses on the bottom end of the funnel. If you have your funnels correctly set up, you can gain valuable split testing information from it. Look for sudden drop-off rates in the funnel – for example if only 18% of the traffic proceeds from step 2 to step 3 in the checkout area, you have a problem in step 2. If you’ve identified a drop-off step in your transactional funnel, you should ask yourself why the problem is happening:
- What information were they looking for?
- Is anything stopping them from taking action on the page?
- What were they expecting to see on the page?
- Where are the visitors coming from?
- Are they not motivated enough to proceed?
Answers to these questions should give a good amount of ideas for split testing.
Prioritize tests based on value and cost
Start with high-value, low-cost testing ideas. An example of this can be testing variations in a checkout process step that is showing significant abandoment rates compared to previous steps. Widerfunnel’s PIE Framework is great for prioritizing:
- Potential – How much potential for a conversion rate increase does this testing opportunity have?
- Importance – How important is this page? How many visitors will be impacted from the test? What is the traffic volume? What is the cost of the traffic? What is the quality of the traffic? What is the impact on ROI?
- Ease – How easy is it to test on the identified page? What are the barriers, both technical and political, to testing that surround this page.
Quantify your opportunities based on this criteria in a scale from 1 to 10. This will give you a good test priority list. You can use the PIE Framework table to get a good overview:

Framework table image from Widerfunnel
Prioritize pages that are important
Pages that have the highest volume should be the most important ones for testing. You have probably identified many pages that perform worse than you would like them to, but if they don’t have a high volume of expensive traffic, you should not count them as priorities.
Pages with a high volume of traffic are more important
You need pages with high traffic for completing your experiments within a reasonable timeframe. Pages with more than 30,000-monthly, unique visitors can reach statistical significance in a few weeks. With a lower level of traffic, you need to run them over a longer period of time. Because tests on high-traffic pages finish sooner, you can move on to the next tests faster, which will speed up your optimization process.
Look for:
- Most-visited pages – Look for information on unique visitors. When looking at the number of overall pageviews, your conversion data will get skewed.
- Top landing (entry) pages – When looking at the most-visited pages, you will see the most popular pages on your site. You also need to look at the most visited pages that people see when they first arrive on your site.
- Pages with expensive visits – When choosing between two pages with similar traffic and conversion rates, pick the one with a higher cost of traffic for a better split-testing ROI.
Step 3) Testing

The reason for the in-depth analysis techniques described above is to get a clear understanding about what is happening on your website and find areas where A/B testing can bring the best results. Now let’s start with setting up your test:
1) Form a clear hypothesis for your test
A hypothesis will define why you believe a problem occurs. If your problem is high abandonment rate in your checkout process, your hypothesis for the reason of that occurring may be that “People start questioning our worth after seeing grammar mistakes ”.
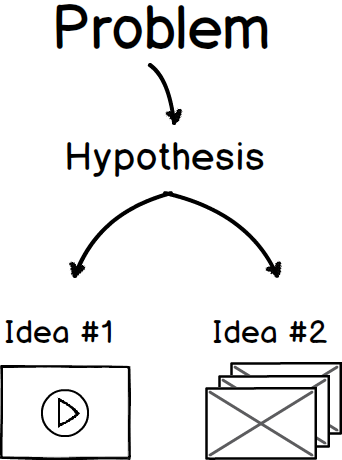
After you have defined your problem and articulated your hypothesis, you can start to come up with specific split-testing variations. Clearly defining your hypothesis will help you come up with testing variations that give meaningful results.
An example of a hypothesis in action:
Problem: Less than one percent of visitors sign up for our newsletter.
Hypothesis: “Visitors don’t see the value in signing up for our newsletter. Adding three bullet points about the benefits will increase signup rates.”
In this case, we would try placing a good summary of benefits the newsletter member would get from joining the newsletter. Even if the original version works better in your A/B test, you learned something about your visitors. You clearly defined why you did the test and can draw conclusions based on the outcome.
A good hypothesis:
- Is testable – Your hypothesis is measurable, so that it can be used in testing
- Has a goal of solving conversion problems – Split testing is done to solve specific conversion problems
- Gains market insights – Besides increasing your conversion rates, split testing will give you information about your clients. A well-articulated hypothesis will let your split testing results give you information about your customers.
2) The importance of testing to statistical relevance
Ignoring statistical confidence while running an A/B test is worse than not running a test at all. The results will give you confidence that you know what works for your site, when in reality, you don’t know more than before running the test.
You need to have sufficient volume in test groups, results and the differences between them. If we were to toss a coin 1,000 times, we would reduce the influence of chance, but still get slightly different results with each trial.
The statistical significance of your experiment should be over 95%. This way you can be sure that your results are valid and not based on chance. It is a measure of confidence.
Testing to statistical relevance is an important subject. Read more about this here
Test for revenue
At the end of the day, revenue is what matters. An increase in conversion rates may sometimes mean a decrease in revenue, if you are not tracking the correct indicators. Let’s imagine that you are selling watches online and suddenly increased your prices by 25%. Your conversion rates will probably drop, but your overall revenue may increase, if the demand for your product is high enough for people to still be buy.
What to test – the low-hanging fruit
You should always see your own analytics and get customer feedback for any hypotheses you test. But for a general guideline, here are some of the elements that have historically given good results:
- Call-To-Actions – Placement, wording, size
- Copywriting – Value propositions, product descriptions
- Forms – Their length, field types, text on the forms.
- Layout – Homepage, content pages, landing pages
- Product pricing – Try testing for revenue by testing your prices
- Images – Their placement, content and size
- Amount of content on the page (short vs. long).
4) Learn from your results and start over

“Never stop testing, and your advertising will never stop improving.” – David Ogilvy
This is the one rule of marketing that surpasses all others. No matter how well your landing pages or e-mails may be doing, they can always be doing better. By not having a goal for constant improvement, you’re leaving money on the table and letting your competition get ahead of you.
Not all split tests will be successful. You are doing well if one in five split tests will improve your conversion rates. Split-testing will simply give you a new baseline to improve upon. You will start seeing considerable website performance improvements after a number of different split tests.
Considering how competitive today’s online market is, if you are not constantly tracking and optimizing, you are going to get left behind, and outsold, by people who are.
A/B testing considerations
Be aware of the local maximum

Most A/B testing is done one variable at a time. You would test headlines, button text, images etc. These variables are simple to test, your results will be clear and your next step will be obvious. By using only one isolated variable, you can be more confident in your results. There’s a downside though.
The argument against only testing single variables is that if you continue to do this for a longer period of time, it will be impossible for you to arrive to a much better design. Instead, you will be improving your existing design in small increments and get stuck in what is called the Local Maximum. This means that you hit a glass ceiling in your design and without a big change, you will be unable have larger gains.
SEO considerations
Google openly endorses split testing, because the goal is to come up with site versions that most accurately reflect what your visitors are seeking, this makes sense. But there are a couple of things you should consider:
Don’t run your experiments longer than needed
If your experiment has been running longer than what Google would normally expect from a split test, it may penalize your site. The general rule is to update your site with the winning variation as soon as you are sure of the statistical significance of the test. Google wants to prevent people from deceiving the search engines with duplicate content.
Use rel=”canonical”
Instead of using a noindex meta tag on your variation page, use rel=canonical. If you are testing two different variations of your homepage, you don’t want the search engines to not index them. You just need the search engines to understand that your variations are what they are – variations of the original URL. Using noindex in a situation like this may create problems later.
Use 302 instead of 301
When you need to redirect a visitor to one of you variations, use a 302 temporary redirection method instead of the permanent 301 version. You want Google to keep the original URL in its index.
Forget about A/A testing
A/A testing is used to validate your test setup – if your variations display correctly and your software is reporting the right numbers. The biggest problem with A/A testing is that both setting it up and running it takes time, which could be used instead for doing more split testing.
“The volume of tests you start is important but even more so, is how many you finish every month.” – Craig Sullivan
It will be quicker for you to just properly test your experiments before going live. To make sure your variations are displaying as they should in different browsers, use cross-browser testing. For checking the numbers, use your split-testing and analytics packages together on every test.
If, for whatever reason, you still need to do an A/A test, consider an A/B/A test, or 25/50/25 split, instead. There is a better way though – segmentation.
For more on this issue, see this great post from Craig Sullivan
Avoid the percentage confusion
Besides significance, the other common problem A/B tests have is quoting the percentages. Since conversion is measured in percentages, there are two ways to be quoting them:
1) Change as the numerical difference between the two variations
2) Change as the amount by which one variation is larger than the other
Normally, version 2 is used when quoting conversion rate improvements, but make sure you know this for sure before deciding anything based on the numbers.
Integrate your A/B testing process with Conversion Rate Optimization methodologies
Your A/B testing efforts will bring better returns when you execute them within a CRO framework. Different agencies have come up with different versions for this. Here are some of them:
The Conversion Rate Experts Methodology

The CRE Methodology™
Conversion Rate Experts have developed a systematic process for guiding a business through a series of steps towards better conversion rates.
Building To The Ultimate Yes by MEClabs

Building To The Ultimate Yes by MECLABS
MEClabs has created a funnel that represents a series of decisions taken by the prospective customer. The idea revolves around the customer taking small decisions step by step, “micro-yeses”, which will ultimately lead towards the Ultimate Yes, or the sale.
The Kaizen Plan by Widerfunnel

The Kaizen Plan by Widerfunnel
The idea is to prioritize conversion testing opportunities and implement the right experiments, which will drive the most impact-filled results. This will help you to maximize your conversion rate improvement.
A Structured Approach to Conversion Rate Optimization by RedEye
A Structured Approach to Conversion Rate Optimization
Together with eConsultancy, RedEye has used findings from three years of research to produce a structure which should help marketers understand what actions will have the greatest improvement on website conversion rates.
Mobile considerations
Visitors interact with their mobile devices through tapping, so their ability to quickly locate and hit these tapping areas is key to satisfying mobile conversion rates. When testing on mobile screens, make an effort to begin testing elements related to the user experience and design of the site, a.k.a. the navigational elements.
Mobile analytics generally fall into two categories – 1) Tracking how people interact with websites through a mobile browser; 2) In-app analytics. Let’s briefly touch on both of these categories:
1) Testing in a mobile browser
If your site’s mobile version has enough traffic going through it, run an A/B test on it. The smaller sized screen forces users to focus more on what is relevant, giving you ample opportunities in the conversion area. In 2012, nearly 34% of US consumers purchased from a mobile phone and these numbers are increasing everyday.
What to test on a mobile site:
- Call-To-Action buttons – You may see results way more successful than on a desktop version here. On a desktop screen, the CTA button will not take more than 2% of the screen real-estate. On a mobile device you have the opportunity to make your CTA button take 25-50% of the screen real estate. You can test any standard property on your button size, copy and visual design.
- Navigation – You will need to change the site navigation anyway for your mobile views. This is a good opportunity to direct visitors directly to the most important page content. Think of mobile navigation as a tool for helping your visitors achieve their goal and remove anything that can get in the way.
- Copywriting – Since the screen real estate of mobile devices is small, you will have a chance to momentarily focus your visitor’s full attention on your value proposition. Test the wording carefully.
- Forms – You can experiment with the design and amount of fields, dropdowns and error messaging.
Google Analytics for mobile tracking
Google Analytics has a mobile section, but it includes both mobile phones and tablets. Accessing a website on a tablet is a different experience from a mobile phone, so make sure you use extra filters for cleaner data.
Compare your site performance (visit duration, bounce rate, conversion rate, etc) for mobile visitors vs. desktop visitors for insights into areas that may cause trouble for your visitors.
PS: Google Analytics only tracks visitors from browsers that support javascript. There are additional analytics solutions available for tracking traffic from non-supporting browsers.
Give your mobile visitors the content they prefer

Use a previously-set advanced segment (where you have filtered out any non-mobile traffic) and apply that to your All Pages report. You will get a good overview on what pages your mobile visitors are most likely to look at. You may find that your mobile visitors are looking for a different type of content than your desktop visitors.
This information can be helpful in testing your mobile menus – You can bring out the content your mobile visitors want to see the most, creating a navigation menu different from your desktop version. Test this to see if you can achieve higher conversion rates.
2) Testing in applications
Google Analytics has a separate tool for measuring and testing variations in your mobile applications. The main difference from testing in a browser is that without putting in some thought, you will have a slower reiteration cycle. You need to upload every test to the app store and wait for your users to update their apps. This means you should carefully think through what you want to track and test in your application before you release it. It will be more difficult to change this after your app has been downloaded.
How is Multivariate Testing different?
When you perform a multivariate test, you are not testing a different version of a web page like you are with an A/B test. You are performing a far more subtle test of the elementsinside one web page .
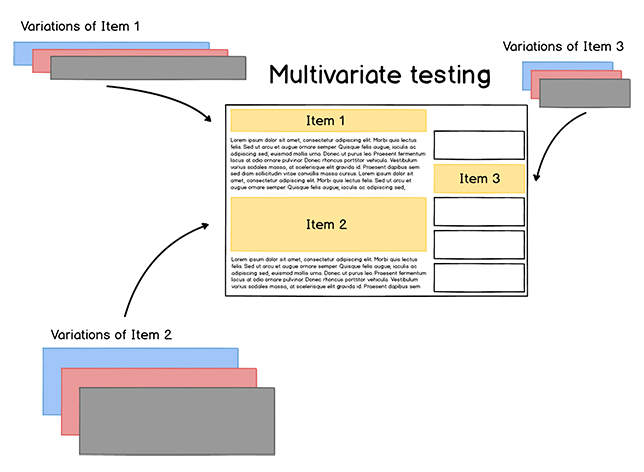
Multivariate testing, or MVT, is a more complex form of testing. A/B testing usually involves less combinations with more extreme changes. Multivariate tests have a large number of variations that usually have subtle differences.
A/B testing is usually a better choice if you need meaningful results fast.Because the changes between pages are more stark, it will be easier to tell which page is more effective. A/B testing is also better if you don’t have a lot of traffic on your site – Multivariate testing, because of the multiple variables being tested together, needs a site with a lot traffic for getting meaningul results.
The goal of multivariate testing is to let you know which elements on your site play the biggest role in achieving your objectives. Multivariate testing is more complicated and is better suited for advanced testers – Because MVT involves multiple variables and looks into how they interact with one another, it is more prone to reporting errors. It is common for a multivariate test to have more than 50 combinations.
Case studies for inspiration
Value Proposition:
Citycliq increased their conversion rates by 90% after experimenting with Value Propositions
Citycliq was testing their value propositions to see what converts the best. Eventually, they concluded that the value proposition with the “Purest, most direct representation of their product” was the winner.
Call To Action:
Barack Obama raised 60 million dollars by running an A/B test
During the election period, the Obama team ran several A/B tests on the campaign’s landing page. The goal was to get people to sign up with their e-mail addresses. A/B testing generated additional 2,880,000 e-mail addresses, which translated to an extra 60 million dollars in donations.
Images:
DHL achieved a 98% conversion rate increase
The challenger page increased the size of the contact form. They also replaced a general logistics image with the image of an actual DHL emplyee.
A/B testing resources
Testing tools:
Free
Google Content Experiments
Formerly known as Google Website Optimizer, which will be discontinued from August 1. It is a robust and free testing platform integrated directly into Google Analytics. Be sure to check out the Multi-Armed Bandit option for an interesting alternative to classic split testing.
Modesty
You need programming skills for setting it up. A robust, basic A/B testing tool.
Paid
Visual Website Optimizer
A simple to use A/B testing tool, used by businesses and agencies. Besides having more complex tools and advanced testing, it lets you set up simpler variations (copywriting changes) without needing to create a new page. Clickmaps and visitor segmentation capabilities are built in. It has good mobile A/B testing abilities and a free trial.
Optimizely
Lets you track visitor engagement, clicks, conversions and any other metric that’s important for your website. Has a nice custom goal tracking option built in. Free trial.
Convert.com
New kid in the block, looks very proimising.
Unbounce
Specialized landing page creator with built-in A/B testing.
For large businesses
Adobe Test&Target
Enterprise-level testing tool from Adobe. Integrated into the larger Marketing Cloud pakcage. Has automated personalization options for behavioral targeting.
Maximyser
Has a plethora of options for split testing, multivariate testing, segmentation, behavioral targeting, personalization. Separate options for Mobile and Social platforms.
Supporting tools
A/B Split Test Significance Calculator by VWO
A widely used tool for calculating the significance of your A/B testing results.
A/B Split and Multivariate Test Duration Calculator by VWO
The calculator allows you to calculate maximum duration for which your test should run.
Crazyegg, Inspectlet, Clicktale and Mouseflow
Heatmap software for tracking your visitor’s behavior on your site. You can get good data for hypotheses generation.
Showcase of A/B tests
Which Test Won
Guess which variation has been more successful and see an archive of A/B tests. Can be used for getting A/B testing ideas.
Surveys
Qualaroo
This is for surveying visitors that are currently surfing your site. We use this in our agency. Allows you to set up behavior-triggered surveys to find out why your customers are behaving the way they do.
Fluidsurveys
A great tool for getting feedback from your visitors – both when abandoning the shopping cart and also when completing a purchase. A lot of extra tools for analyzing responses. Works well on mobile browsers.
Surveymonkey
Surveymonkey has been around for a long time and offers a stable experience. Has good analytical tools for analyzing your responses.
Google Docs
Free and easy to use. Data is collected into spreadsheets which makes the data easy to analyze.
Typeform
The prettiest survey tool of all.
In Summary

A/B testing is about knowing your visitors. You will learn valuable insights, because you will “know” instead of “thinking” about their preferences.![]() You should always integrate A/B testing into a larger conversion optimization framework for good results. In the end, the testing is all about knowing if your hypotheses are right, and if your conversion plan is on the right course.
You should always integrate A/B testing into a larger conversion optimization framework for good results. In the end, the testing is all about knowing if your hypotheses are right, and if your conversion plan is on the right course.
The main reason for doing split testing is to maximize the conversion potential of your website. It makes sense to invest in conversion rate optimization before spending money on large-scale advertising campaigns. After a while your conversion funnel will be effective enough that you can transfer your winning campaigns to other media. Because your core is optimized so well, by the time you go to offline media, your campaigns will convert well enough to pay off.
Key Takeaways
- Make sure you are getting actionable data from Google Analytics – To make use of data, you need to have goals first. Define your target metrics.
- Use qualitative surveys – Besides knowing what is going on, you also need to know why.
- Segment – It’s the only way to get information that is actually valuable.
- Prioritize – Test pages with higher potential first.
- Form a hypothesis – A/B testing has to start from a clearly defined hypothesis.
- Statistical relevance – Never stop split testing before reaching a significance percentage of at least 95%.
- Never stop testing – No matter how well your landing pages or e-mails may be doing, they can always do better.
- A/B testing is part of a conversion rate optimization framework – Pick a framework and work on it constantly to maximize your site’s potential.


 1万+
1万+


 被折叠的 条评论
为什么被折叠?
被折叠的 条评论
为什么被折叠?
 到【灌水乐园】发言


