


一、hog特征详解(点击[]可以进入我所参考的博客)
1.hog特征原理
1.HOG的核心思想是所检测的局部物体外形能够被光强梯度或边缘方向的分布所描述。[1]
- 通过将整幅图像分割成小的连接区域(称为cells),每个cell生成一个方向梯度直方图或者cell中pixel的边缘方向,这些直方图的组合可表示出(所检测目标的目标)描述子。为改善准确率,局部直方图可以通过计算图像中一个较大区域(称为block)的光强作为measure被对比标准化,然后用这个值(measure)归一化这个block中的所有cells.这个归一化过程完成了更好的照射/阴影不变性。
- hog特征优点:
(1).几何和光学转化不变性,尤其适合人的检测。
(2).Hog没有旋转和尺度不变性。(所以计算量小) - 那么行人检测中怎么应用HOG呢?
对于解决Scale-invariant的问题:将图片进行不同尺度的缩放,就相当于对模板进行不同尺度scale的缩放。
对于解决Rotation-invariant 的问题:建立不同方向的模版(一般取15*7的)进行匹配。
2.hog实现原理
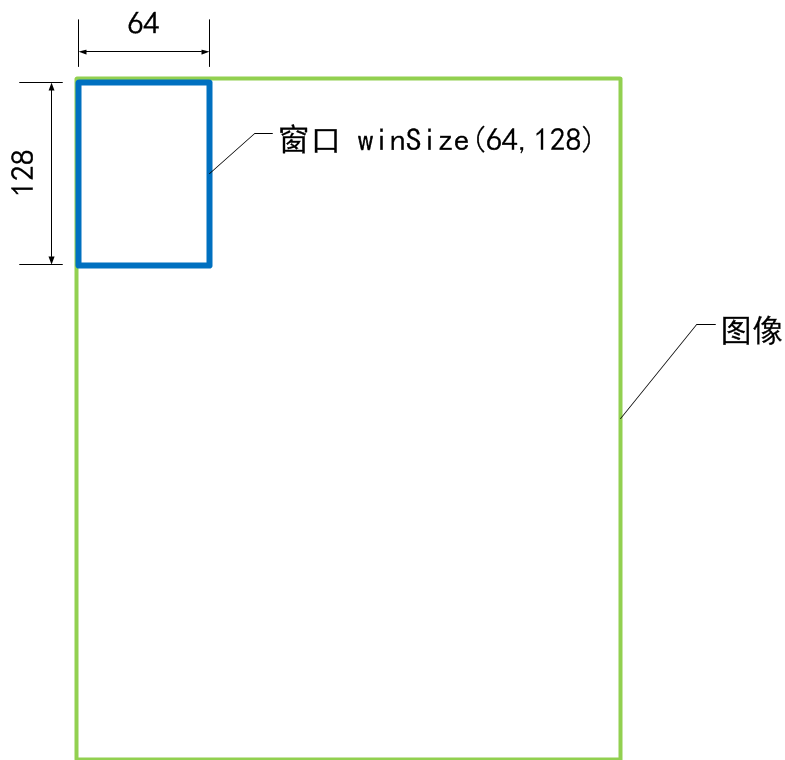
- 对于一个image,在一个大小为winSIZE的检测窗口中,用一个大小为blockSIZE的block来扫描整个检测窗口,每个block又分为四个cell,每次block扫描都输出四个cell的梯度信息然后保存到特征向量中。
- 这三者的示意图如下:[2]
- 窗口大小 winSize
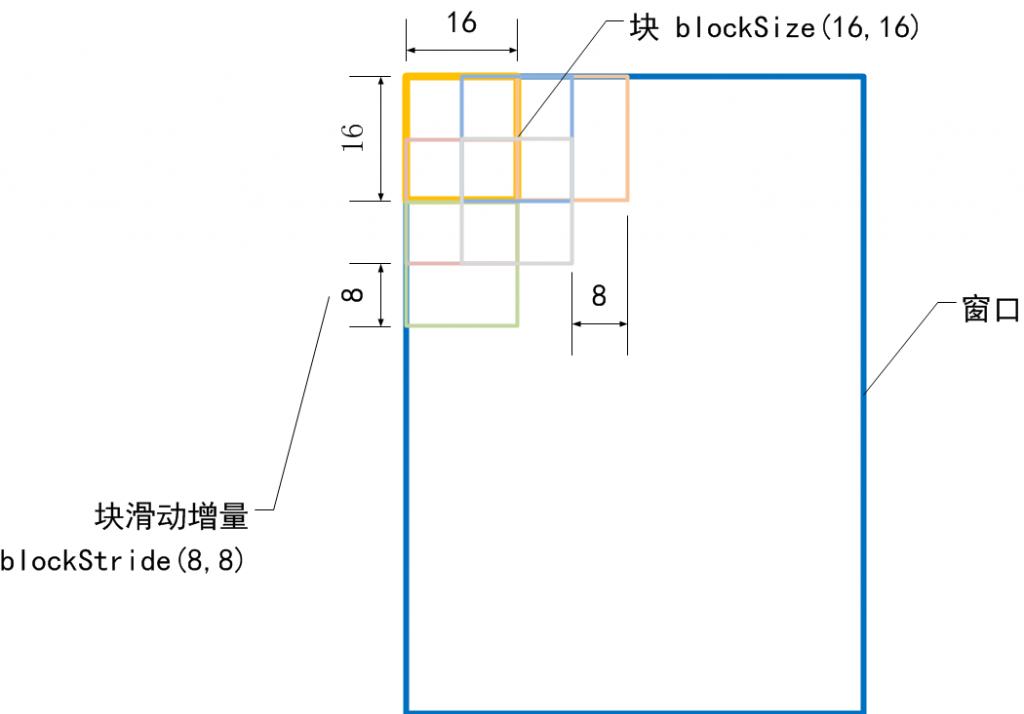
- 块大小 blockSize
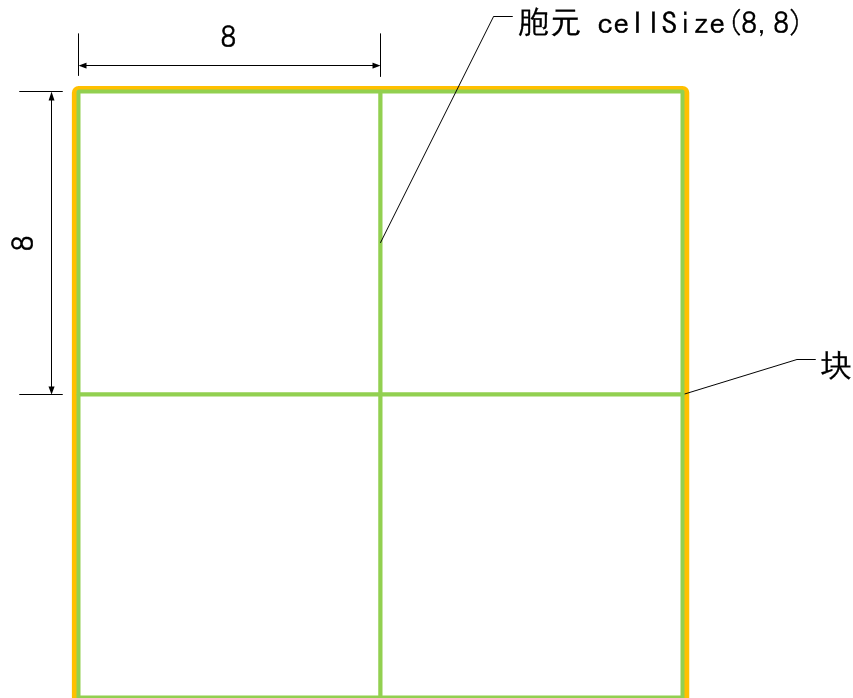
- 胞元大小 cellSize
- 窗口大小 winSize
- 通俗的讲:
HOG特征提取方法就是将一个image:
- 灰度化(将图像看做一个x,y,z(灰度)的三维图像)
- 划分成小cells(2*2)
- 计算每个cell中每个pixel的gradient(即orientation)
- 统计每个cell的梯度直方图(不同梯度的个数),即可形成每个cell的descriptor
- 对opencv中的hog源码中一些固定参数来个简单说明:
检测窗口大小为128*64;
Block大小为16*16;
Cell大小为8*8;
Block在检测窗口中上下移动尺寸为8*8;
1个cell的梯度直方图化成9个bin;
滑动窗口在检测图片中滑动的尺寸为8*8;
代码中的一个hog描述子是针对一个检测窗口而言的,所以一个检测窗口共有105=((128-16)/8+1)*((64-16)/8+1)个block;一个block中有4个cell,而一个cell的hog描述子向量的长度为9;所以检测窗口的hog向量长度=3780=105*4*9维。每次block扫描都输出四个cell的梯度信息然后保存到特征向量中,知道扫描完最后特征向量输出3780维的向量。
3.hog可视化理解[3]
//hog可视化代码
#include <opencv2/opencv.hpp>
#include <cstdio>
#include <cstdlib>
#include <Windows.h>
using namespace std;
using namespace cv;
// HOGDescriptor visual_imagealizer
// adapted for arbitrary size of feature sets and training images
Mat get_hogdescriptor_visual_image(Mat& origImg,
vector<float>& descriptorValues,//hog特征向量
Size winSize,//图片窗口大小
Size cellSize,
int scaleFactor,//缩放背景图像的比例
double viz_factor)//缩放hog特征的线长比例
{
Mat visual_image;//最后可视化的图像大小
resize(origImg, visual_image, Size(origImg.cols*scaleFactor, origImg.rows*scaleFactor));
int gradientBinSize = 9;
// dividing 180° into 9 bins, how large (in rad) is one bin?
float radRangeForOneBin = 3.14/(float)gradientBinSize; //pi=3.14对应180°
// prepare data structure: 9 orientation / gradient strenghts for each cell
int cells_in_x_dir = winSize.width / cellSize.width;//x方向上的cell个数
int cells_in_y_dir = winSize.height / cellSize.height;//y方向上的cell个数
int totalnrofcells = cells_in_x_dir * cells_in_y_dir;//cell的总个数
//注意此处三维数组的定义格式
//int ***b;
//int a[2][3][4];
//int (*b)[3][4] = a;
//gradientStrengths[cells_in_y_dir][cells_in_x_dir][9]
//上面一个是来记录总的梯度信息,下面一个是记录这个cell被记录了多少次
float*** gradientStrengths = new float**[cells_in_y_dir];
int** cellUpdateCounter = new int*[cells_in_y_dir];
for (int y=0; y<cells_in_y_dir; y++)
{
gradientStrengths[y] = new float*[cells_in_x_dir];
cellUpdateCounter[y] = new int[cells_in_x_dir];
for (int x=0; x<cells_in_x_dir; x++)
{
//将每一点的梯度值分为9份
gradientStrengths[y][x] = new float[gradientBinSize];
cellUpdateCounter[y][x] = 0;
for (int bin=0; bin<gradientBinSize; bin++)
gradientStrengths[y][x][bin] = 0.0;//把每个cell的9个bin对应的梯度强度都初始化为0
}
}
// nr of blocks = nr of cells - 1
// since there is a new block on each cell (overlapping blocks!) but the last one
//相当于blockstride = (8,8)
int blocks_in_x_dir = cells_in_x_dir - 1;//这是代表是block也是在扫描的吗?最后一个不用组成一个block了,这里block横向纵向都是cell的俩倍
int blocks_in_y_dir = cells_in_y_dir - 1;
// compute gradient strengths per cell
int descriptorDataIdx = 0;
int cellx = 0;
int celly = 0;
for (int blockx=0; blockx<blocks_in_x_dir; blockx++)
{
for (int blocky=0; blocky<blocks_in_y_dir; blocky++)
{
// 4 cells per block ...
for (int cellNr=0; cellNr<4; cellNr++)
{
// compute corresponding cell nr
//分为0,1,2,3四个格子,第0个即与block的坐标相同,其余相应加1
int cellx = blockx;
int celly = blocky;
if (cellNr==1) celly++;
if (cellNr==2) cellx++;
if (cellNr==3)
{
cellx++;
celly++;
}
//
for (int bin=0; bin<gradientBinSize; bin++)
{
float gradientStrength = descriptorValues[ descriptorDataIdx ];
descriptorDataIdx++;
//初始每个cell里面的都为0,blcok每扫描一次,都会有一个新的特征向量记录下来,这个是把每次重复计算cell时,得到的梯度特征信息都叠加到一起,然后再用于后面的显示
gradientStrengths[celly][cellx][bin] += gradientStrength;//因为C是按行存储
} // for (all bins)
// note: overlapping blocks lead to multiple updates of this sum!
// we therefore keep track how often a cell was updated,
// to compute average gradient strengths
cellUpdateCounter[celly][cellx]++;//由于block之间有重叠,所以要记录哪些cell被多次计算了
} // for (all cells)
} // for (all block x pos)
} // for (all block y pos)
// compute average gradient strengths
for (int celly=0; celly<cells_in_y_dir; celly++)
{
for (int cellx=0; cellx<cells_in_x_dir; cellx++)
{
float NrUpdatesForThisCell = (float)cellUpdateCounter[celly][cellx];
// compute average gradient strenghts for each gradient bin direction
for (int bin=0; bin<gradientBinSize; bin++)
{
//计算平均梯度信息
gradientStrengths[celly][cellx][bin] /= NrUpdatesForThisCell;
}
}
}
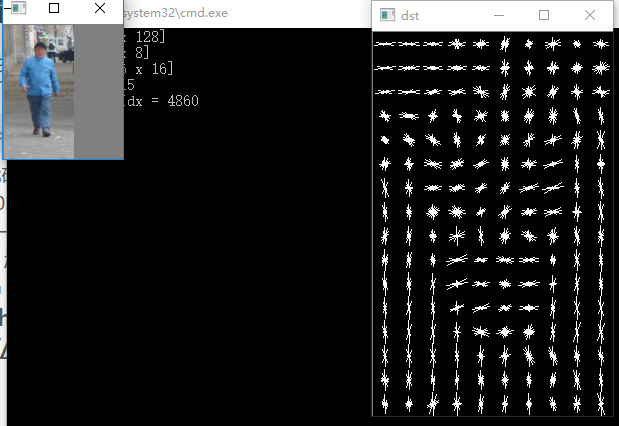
cout << "winSize = " << winSize << endl;
cout << "cellSize = " << cellSize << endl;
cout << "blockSize = " << cellSize*2<< endl;
cout << "blockNum = " << blocks_in_x_dir<<"×"<<blocks_in_y_dir << endl;
cout << "descriptorDataIdx = " << descriptorDataIdx << endl;
// draw cells
for (int celly=0; celly<cells_in_y_dir; celly++)
{
for (int cellx=0; cellx<cells_in_x_dir; cellx++)
{
int drawX = cellx * cellSize.width;
int drawY = celly * cellSize.height;
int mx = drawX + cellSize.width/2;
int my = drawY + cellSize.height/2;
rectangle(visual_image,
Point(drawX*scaleFactor,drawY*scaleFactor),
Point((drawX+cellSize.width)*scaleFactor,
(drawY+cellSize.height)*scaleFactor),
CV_RGB(0,0,0),//cell框线的颜色
1);
// draw in each cell all 9 gradient strengths
for (int bin=0; bin<gradientBinSize; bin++)
{
float currentGradStrength = gradientStrengths[celly][cellx][bin];
// no line to draw?
if (currentGradStrength==0)
continue;
float currRad = bin * radRangeForOneBin + radRangeForOneBin/2;//取每个bin里的中间值,如10°,30°,...,170°.
float dirVecX = cos( currRad );
float dirVecY = sin( currRad );
float maxVecLen = cellSize.width/2;
float scale = viz_factor; // just a visual_imagealization scale,
// to see the lines better
// compute line coordinates
float x1 = mx - dirVecX * currentGradStrength * maxVecLen * scale;
float y1 = my - dirVecY * currentGradStrength * maxVecLen * scale;
float x2 = mx + dirVecX * currentGradStrength * maxVecLen * scale;
float y2 = my + dirVecY * currentGradStrength * maxVecLen * scale;
// draw gradient visual_imagealization
line(visual_image,
Point(x1*scaleFactor,y1*scaleFactor),
Point(x2*scaleFactor,y2*scaleFactor),
CV_RGB(255,255,255),//HOG可视化的cell的颜色
1);
} // for (all bins)
} // for (cellx)
} // for (celly)
// don't forget to free memory allocated by helper data structures!
for (int y=0; y<cells_in_y_dir; y++)
{
for (int x=0; x<cells_in_x_dir; x++)
{
delete[] gradientStrengths[y][x];
}
delete[] gradientStrengths[y];
delete[] cellUpdateCounter[y];
}
delete[] gradientStrengths;
delete[] cellUpdateCounter;
return visual_image;//返回最终的HOG可视化图像
}
int main()
{
HOGDescriptor hog;//使用的是默认的hog参数
/*
HOGDescriptor(Size win_size=Size(64, 128), Size block_size=Size(16, 16), Size block_stride=Size(8, 8),
Size cell_size=Size(8, 8), int nbins=9, double win_sigma=DEFAULT_WIN_SIGMA(DEFAULT_WIN_SIGMA=-1),
double threshold_L2hys=0.2, bool gamma_correction=true, int nlevels=DEFAULT_NLEVELS)
Parameters:
win_size – Detection window size. Align to block size and block stride.
block_size – Block size in pixels. Align to cell size. Only (16,16) is supported for now.
block_stride – Block stride. It must be a multiple of cell size.
cell_size – Cell size. Only (8, 8) is supported for now.
nbins – Number of bins. Only 9 bins per cell are supported for now.
win_sigma – Gaussian smoothing window parameter.
threshold_L2hys – L2-Hys normalization method shrinkage.
gamma_correction – Flag to specify whether the gamma correction preprocessing is required or not.
nlevels – Maximum number of detection window increases.
*/
//对于128*80的图片,blockstride = 8,15*9的block,2*2*9*15*9 = 4860
int width = 80;
int height = 128;
hog.winSize=Size(width,height);
vector<float> des;//HOG特征向量
Mat src = imread("objimg.jpg");
Mat dst ;
resize(src,dst,Size(width,height));//规范图像尺寸
//即一幅图一个wimSize全扫描完了
imshow("src",src);
hog.compute(dst,des);//计算hog特征
Mat background = Mat::zeros(Size(width,height),CV_8UC1);//设置黑色背景图,因为要用白色绘制hog特征
Mat d = get_hogdescriptor_visual_image(background,des,hog.winSize,hog.cellSize,3,2.5);
imshow("dst",d);
imwrite("hogvisualize.jpg",d);
waitKey();
return 0;
}
原图

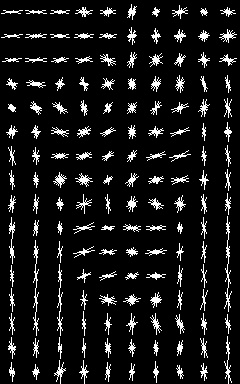
hog特征图


 1万+
1万+


 被折叠的 条评论
为什么被折叠?
被折叠的 条评论
为什么被折叠?
 到【灌水乐园】发言


