


k-means是机器学习中聚类算法的一种,也是最容易理解的。
算法思想:
通过迭代,寻找K个聚类的划分方案。
使得K个聚类的总体误差最小,其中误差用均值表示。
算法步骤:
1、根据用户给定的K值,随机选取K个聚类质心
2、重复如下步骤直到收敛(即没有样本所属聚类发生变化)
2.1、计算每个样本点的所属聚类
2.2、统计聚类样本,更新每个聚类质心
2.3、样本点所属聚类不再变化,即收敛。分类结束
python代码如下:
#!/usr/bin/env python
# coding=utf-8

#################################################
# kmeans: k-means cluster
# Author : zouxy
# Date   : 2013-12-25
# HomePage : http://blog.csdn.net/zouxy09
# Email  : zouxy09@qq.com
#################################################

from numpy import *
import time
import matplotlib.pyplot as plt


# calculate Euclidean distance
def euclDistance(vector1, vector2):
    return sqrt(sum(power(vector2 - vector1, 2)))

# init centroids with random samples
def initCentroids(dataSet, k):
    numSamples, dim = dataSet.shape
    centroids = zeros((k, dim))
    for i in range(k):
        index = int(random.uniform(0, numSamples))      #样本集随机挑一个,作为初始质心
        centroids[i, :] = dataSet[index, :]
    return centroids

# k-means cluster
def kmeans(dataSet, k):
    numSamples = dataSet.shape[0]
    # first column stores which cluster this sample belongs to,
    # second column stores the error between this sample and its centroid
    clusterAssment = mat(zeros((numSamples, 2)))
    clusterChanged = True

    ## step 1: init centroids
    centroids = initCentroids(dataSet, k)

    while clusterChanged:
        clusterChanged = False
        ## for each sample
        for i in range(numSamples):
            minDist  = 100000.0     #与最近族群距离
            minIndex = 0            #所属族
            ## for each centroid
            ## step 2: find the centroid who is closest
            for j in range(k):
                distance = euclDistance(centroids[j, :], dataSet[i, :])
                if distance < minDist:      #更新最小距离,所属族
                    minDist  = distance
                    minIndex = j

            ## step 3: update its cluster
            if clusterAssment[i, 0] != minIndex:        #所属族群有变化
                clusterChanged = True
                clusterAssment[i, :] = minIndex, minDist**2 #族群索引号,距离

        ## step 4: update centroids
        for j in range(k):
            test1 = clusterAssment[:,0]     #获取所属族群
            test2 = clusterAssment[:,0].A   #转换为数组
            test3 = clusterAssment[:,0].A == j  #判断是否属于族群J
            test4 = nonzero(test3)              #属于族群J的索引值
            test5 = test4[0]
            test6 = dataSet[test5]
            pointsInCluster = dataSet[nonzero(clusterAssment[:, 0].A == j)[0]]
#             pointsInCluster = dataSet[nonzero(clusterAssment[:, 0].A == j)[0]]
            centroids[j, :] = mean(pointsInCluster, axis = 0)   #所有族群元素特征值求平均

    print('Congratulations, cluster complete!')
    return centroids, clusterAssment

# show your cluster only available with 2-D data
def showCluster(dataSet, k, centroids, clusterAssment):
    numSamples, dim = dataSet.shape
    if dim != 2:
        print("Sorry! I can not draw because the dimension of your data is not 2!")
        return 1

    #color
    mark = ['or', 'ob', 'og', 'ok', '^r', '+r', 'sr', 'dr', '<r', 'pr']
    if k > len(mark):
        print("Sorry! Your k is too large! please contact Zouxy")
        return 1

    # draw all samples
    for i in range(numSamples):
        markIndex = int(clusterAssment[i, 0])   #每个样本所属族群
        plt.plot(dataSet[i, 0], dataSet[i, 1], mark[markIndex])

    mark = ['Dr', 'Db', 'Dg', 'Dk', '^b', '+b', 'sb', 'db', '<b', 'pb']
    # draw the centroids
    for i in range(k):
        plt.plot(centroids[i, 0], centroids[i, 1], mark[i], markersize = 6)

    plt.show()
测试代码如下:
#!/usr/bin/env python
# coding=utf-8
#################################################
# kmeans: k-means cluster
# Author : zouxy
# Date : 2013-12-25
# HomePage : http://blog.csdn.net/zouxy09
# Email : zouxy09@qq.com
#################################################
from numpy import *
import time
import matplotlib.pyplot as plt
import kmeans
## step 1: load data
print("step 1: load data...")
dataSet = []
fileIn = open('D:\python workspace\src\kmeans/testSet.txt')
for line in fileIn.readlines():
lineArr = line.strip().split('\t')
dataSet.append([float(lineArr[0]), float(lineArr[1])]) #读取文件内容,放入dataSet
## step 2: clustering...
print("step 2: clustering...")
dataSet = mat(dataSet)
k = 4
centroids, clusterAssment = kmeans.kmeans(dataSet, k)
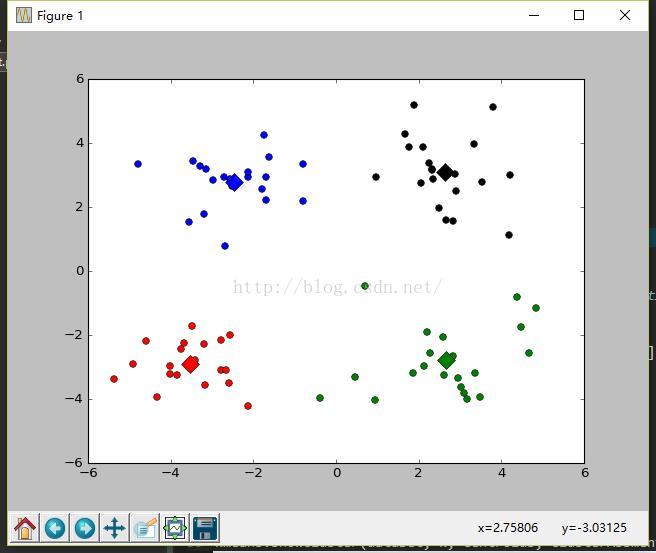
## step 3: show the result
print("step 3: show the result...")
kmeans.showCluster(dataSet, k, centroids, clusterAssment)
注意事项:
1、K-means需要人为事先给出K值,这在很多情况下很难做到。解决方法:先计算数据分布(重心、密度等),再给出K值。
2、对初始质心的选择敏感,容易陷入局部最小值点,而非全局最小值点。解决方法:二分K均值聚类
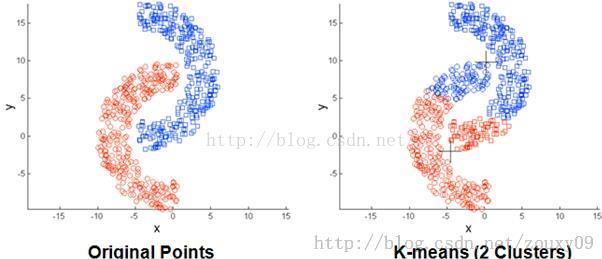
3、存在局限性,对于非球状数据无能为力。(见下图)
4、数据量大时,收敛速度很慢。


 被折叠的 条评论
为什么被折叠?
被折叠的 条评论
为什么被折叠?
 到【灌水乐园】发言


