


简介
sklearn.datasets 包提供了一些小的toy数据集。为了评估数据特征(n_samples,n_features)的影响,可以控制数据的一些统计学特性,产生人工数据。
这个包提供一些接口,来获取真实的机器学习社区常用于基准算法的大数据集。
常见的dataset API
sklearn对于不同的数据类型提供三种数据接口。
- sample images是最简单的接口
dataset 产生函数和svmlight 加载器共享一个接口
返回一个元组(X,y),包含(n_samples,n_features)的Nnmpy数组,和一个长为n_samples的标签y
toy dataset和来自mldata.org上的数据都有比较复杂的结构
这些数据对象包含一个data为key,(n_samples,n_features)Numpy对象为value的dict对象,以及一个target为key,n_samples长的Numpy数组为value的dict对象。前一个dict表示特征,后一个对象是对应的标签。
Toy datasets
sklearn包含一些不许要下载的toy数据集,见下表:
| 导入toy数据的方法 | 介绍 | 任务 | 数据规模 |
|---|---|---|---|
| load_boston() | 加载和返回一个boston房屋价格的数据集 | 回归 | 506*13 |
| load_iris([return_X_y]) | 加载和返回一个鸢尾花数据集 | 分类 | 150*4 |
| load_diabetes() | 加载和返回一个糖尿病数据集 | 回归 | 442*10 |
| load_digits([n_class]) | 加载和返回一个手写字数据集 | 分类 | 1797*64 |
| load_linnerud() | 加载和返回健身数据集 | 多分类 | 20 |
from sklearn.datasets import load_linnerud
linnerud = load_linnerud()linnerud.dataarray([[ 5., 162., 60.],
[ 2., 110., 60.],
[ 12., 101., 101.],
[ 12., 105., 37.],
[ 13., 155., 58.],
[ 4., 101., 42.],
[ 8., 101., 38.],
[ 6., 125., 40.],
[ 15., 200., 40.],
[ 17., 251., 250.],
[ 17., 120., 38.],
[ 13., 210., 115.],
[ 14., 215., 105.],
[ 1., 50., 50.],
[ 6., 70., 31.],
[ 12., 210., 120.],
[ 4., 60., 25.],
[ 11., 230., 80.],
[ 15., 225., 73.],
[ 2., 110., 43.]])
linnerud.targetarray([[ 191., 36., 50.],
[ 189., 37., 52.],
[ 193., 38., 58.],
[ 162., 35., 62.],
[ 189., 35., 46.],
[ 182., 36., 56.],
[ 211., 38., 56.],
[ 167., 34., 60.],
[ 176., 31., 74.],
[ 154., 33., 56.],
[ 169., 34., 50.],
[ 166., 33., 52.],
[ 154., 34., 64.],
[ 247., 46., 50.],
[ 193., 36., 46.],
[ 202., 37., 62.],
[ 176., 37., 54.],
[ 157., 32., 52.],
[ 156., 33., 54.],
[ 138., 33., 68.]])
linnerud.feature_names['Chins', 'Situps', 'Jumps']
linnerud.target_names['Weight', 'Waist', 'Pulse']
Sample images
sklearn 带有一组JPEG格式的图片,可用与测试需要2D数据的算法和流程
| 导入图片数据的方法 | 介绍 |
|---|---|
| load_sample_images() | 导入样本图片,用于加载自带的2个图片 |
| load_sample_image(image_name) | 导入单个图片,返回numpy数组,用于加载外部图片 |
Sample generators
sklearn可以产生不同大小和复杂程度的人工的随机样本。
产生用于分类和聚类的数据
产生一个包含特征值的矩阵和一个独立的标签列矩阵
单标签
make_blobs 产生多类数据集,对每个类的中心和标准差有很好的控制
输入参数:
sklearn.datasets.make_blobs(n_samples=100, n_features=2, centers=3, cluster_std=1.0, center_box=(-10.0, 10.0), shuffle=True, random_state=None)[source]| 参数 | 类型 | 默认 | 说明 |
|---|---|---|---|
| n_samples | int类型 | 可选参数 (default=100) | 总的点数,平均的分到每个clusters中。 |
| n_features | int类型 | 可选参数 (default=2) | 每个样本的特征维度。 |
| centers | int类型 or 聚类中心坐标元组构成的数组类型 | 可选参数(default=3) | 产生的中心点的数量, or 固定中心点位置。 |
| cluster_std | float or floats序列 | 可选参数 (default=1.0) | clusters的标准差。 |
| center_box | 一对floats (min, max) | 可选参数 (default=(-10.0, 10.0)) | 随机产生数据的时候,每个cluster中心的边界。 |
| shuffle | boolean | 可选参数 (default=True) | 打乱样本。 |
| random_state | int, RandomState对象 or None | 可选参数 (default=None) | 如果是int,random_state作为随机数产生器的seed; 如果是RandomState对象, random_state是随机数产生器; 如果是None, RandomState 对象是随机数产生器通过np.random. |
返回的是:
- X:[n_samples,n_features]大小的特征矩阵
- y: [n_samples]大小的标签数据矩阵,对应特征矩阵的每一行
例子:
产生两类样本点,两个聚类中心,坐标是(-3, -3)和(3, 3); 方差是0.5和0.7; 样本点有1000个,每个点维度是2维
from sklearn.datasets.samples_generator import make_blobs
centers = [(-3, -3),(3, 3)]
cluster_std = [0.5,0.7]
X,y = make_blobs(n_samples=1000, centers=centers,n_features=2, random_state=0, cluster_std=cluster_std)

%matplotlib inline
import matplotlib
import matplotlib.pyplot as plt
plt.style.use('ggplot')
plt.figure(figsize=(20,5));
plt.subplot(1, 2, 1 );
plt.scatter(X[:,0] , X[:,1],  c = y, alpha = 0.7);
plt.subplot(1, 2, 2);
plt.hist(y)
plt.show()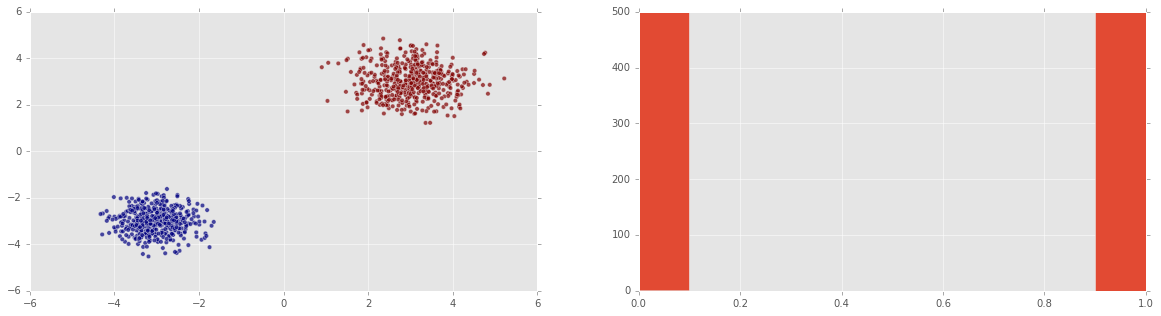
产生3类样本点,3个距离中心,方差分别是0.5,0.7,0.5,样本点2000个
from sklearn.datasets.samples_generator import make_blobs
centers = [(-3, -3),(0,0),(3, 3)]
cluster_std = [0.5,0.7,0.5]
X,y = make_blobs(n_samples=2000, centers=centers,n_features=2, random_state=0, cluster_std=cluster_std)

%matplotlib inline
import matplotlib
import matplotlib.pyplot as plt
plt.style.use('ggplot')
plt.figure(figsize=(20,5));
plt.subplot(1, 2, 1 );
plt.scatter(X[:,0] , X[:,1],  c = y, alpha = 0.7);
plt.subplot(1, 2, 2);
plt.hist(y)
plt.show()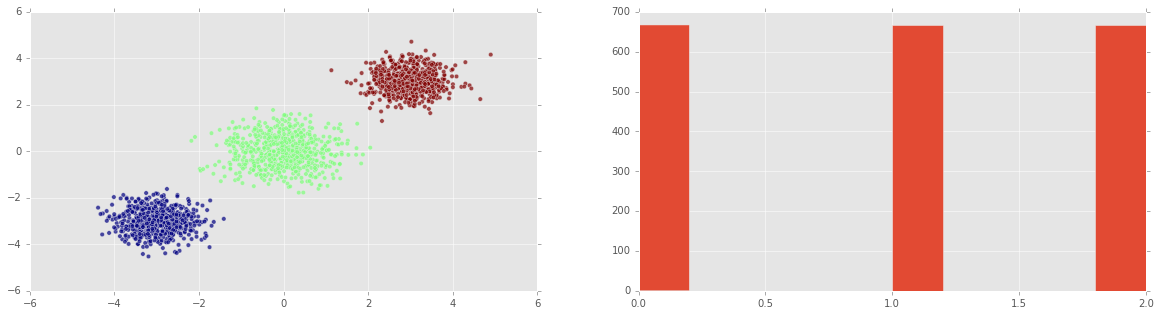
make_classification:可以在模拟数据中添加噪声
输入参数:
sklearn.datasets.make_classification(n_samples=100, n_features=20, n_informative=2, n_redundant=2, n_repeated=0, n_classes=2, n_clusters_per_class=2, weights=None, flip_y=0.01, class_sep=1.0, hypercube=True, shift=0.0, scale=1.0, shuffle=True, random_state=None)| 参数 | 类型 | 默认 | 说明 |
|---|---|---|---|
| n_samples | int类型 | 可选 (default=100) | 样本数量. |
| n_features | int | 可选 (default=20) | 总的特征数量,是从有信息的数据点,冗余数据点,重复数据点,和特征点-有信息的点-冗余的点-重复点中随机选择的。 |
| n_informative | int | optional (default=2) | informative features数量 |
| n_redundant | int | optional (default=2) | redundant features数量 |
| n_repeated | int | optional (default=0) | duplicated features数量 |
| n_classes | int | optional (default=2) | 类别或者标签数量 |
| n_clusters_per_class | int | optional (default=2) | 每个class中cluster数量 |
| weights | floats列表 or None | (default=None) | 每个类的权重,用于分配样本点 |
| flip_y | float | optional (default=0.01) | 随机交换样本的一段 |
| class_sep | float | optional (default=1.0) | The factor multiplying the hypercube dimension. |
| hypercube | boolean | optional (default=True) | If True the clusters are put on the vertices of a hypercube. If False,the clusters are put on the vertices of a random polytope. |
| shift | float,array of shape [n_features] or None | optional (default=0.0) | Shift features by the specified value. If None,then features are shifted by a random value drawn in [-class_sep,class_sep]. |
| scale | float array of shape [n_features] or None | optional (default=1.0) | Multiply features by the specified value. If None,then features are scaled by a random value drawn in [1,100]. Note that scaling happens after shifting. |
| shuffle | boolean | optional (default=True) | Shuffle the samples and the features. |
| random_state | int,RandomState instance or None | optional (default=None) | If int,random_state is the seed used by the random number generator; If RandomState instance,random_state is the random number generator; If None,the random number generator is the RandomState instance used by np.random. |
返回的是:
- X : array of shape [n_samples, n_features]; 特征矩阵
- y : array of shape [n_samples]:矩阵每一行的整数类型标签
例子:
from sklearn.datasets.samples_generator import make_classification
X,y = make_classification(n_samples=2000, n_features=10, n_informative=4, n_classes=4, random_state=0)

%matplotlib inline
import matplotlib
import matplotlib.pyplot as plt
plt.style.use('ggplot')
plt.figure(figsize=(20,5));
plt.subplot(1, 2, 1 );
plt.scatter(X[:,0] , X[:,1],  c = y, alpha = 0.7);
plt.subplot(1, 2, 2);
plt.hist(y)
plt.show()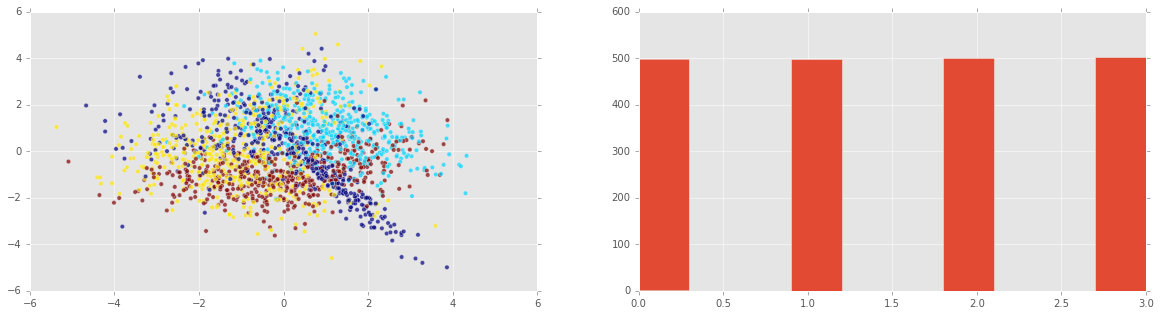
make_gaussian_quantiles 产生高斯分布
输入参数:
sklearn.datasets.make_gaussian_quantiles(mean=None, cov=1.0, n_samples=100, n_features=2, n_classes=3, shuffle=True, random_state=None)| 参数 | 类型 | 默认 | 说明 |
|---|---|---|---|
| mean | array of shape [n_features] | optional (default=None) | The mean of the multi-dimensional normal distribution. If None then use the origin (0, 0, …). |
| cov | float | optional (default=1.) | The covariance matrix will be this value times the unit matrix. This dataset only produces symmetric normal distributions. |
| n_samples | int | optional (default=100) | The total number of points equally divided among classes. |
| n_features | int | optional (default=2) | The number of features for each sample. |
| n_classes | int | optional (default=3) | The number of classes |
| shuffle | boolean | optional (default=True) | Shuffle the samples. |
| random_state | int, RandomState instance or None | optional (default=None) | If int, random_state is the seed used by the random number generator; If RandomState instance, random_state is the random number generator; If None, the random number generator is the RandomState instance used by np.random. |
from sklearn.datasets.samples_generator import make_gaussian_quantiles
X,y = make_gaussian_quantiles(mean=(1,1), cov=1.0, n_samples=1000, n_features=2, n_classes=2, shuffle=True, random_state=None)

%matplotlib inline
import matplotlib
import matplotlib.pyplot as plt
plt.style.use('ggplot')
plt.figure(figsize=(20,5));
plt.subplot(1, 2, 1 );
plt.scatter(X[:,0] , X[:,1],  c = y, alpha = 0.7);
plt.subplot(1, 2, 2);
plt.hist(y)
plt.show()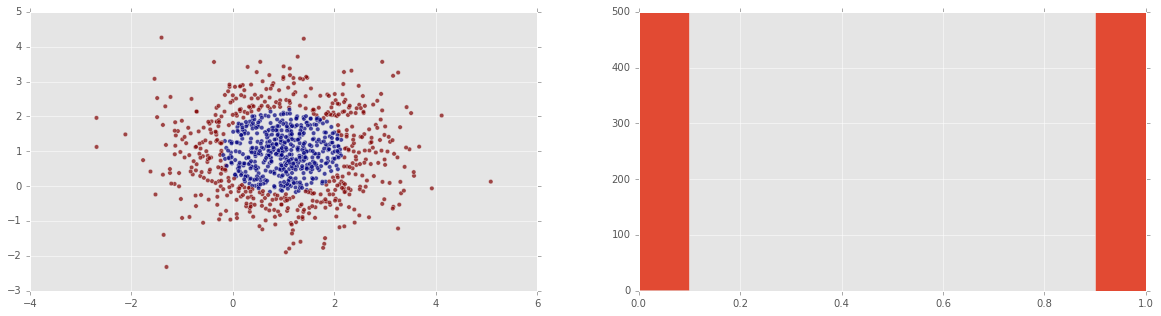
make_hastie_10_2
产生用于二分类的数据。Hastie et al. 2009
输入参数:
| 参数 | 类型 | 默认 | 说明 |
|---|---|---|---|
| n_samples | int | optional (default=12000) | The number of samples. |
| random_state | int, RandomState instance or None | optional (default=None) | If int, random_state is the seed used by the random number generator; If RandomState instance, random_state is the random number generator; If None, the random number generator is the RandomState instance used by np.random. |
输出:
- X : array of shape [n_samples, 10] 特征矩阵。
- y : array of shape [n_samples],对应特征矩阵每一个行的真实值。
from sklearn.datasets.samples_generator import make_hastie_10_2
X,y = make_hastie_10_2(n_samples=1000, random_state=None)

%matplotlib inline
import matplotlib
import matplotlib.pyplot as plt
plt.style.use('ggplot')
plt.figure(figsize=(20,5));
plt.subplot(1, 2, 1 );
plt.scatter(X[:,0] , X[:,1],  c = y, alpha = 0.7);
plt.subplot(1, 2, 2);
plt.hist(y)
plt.show()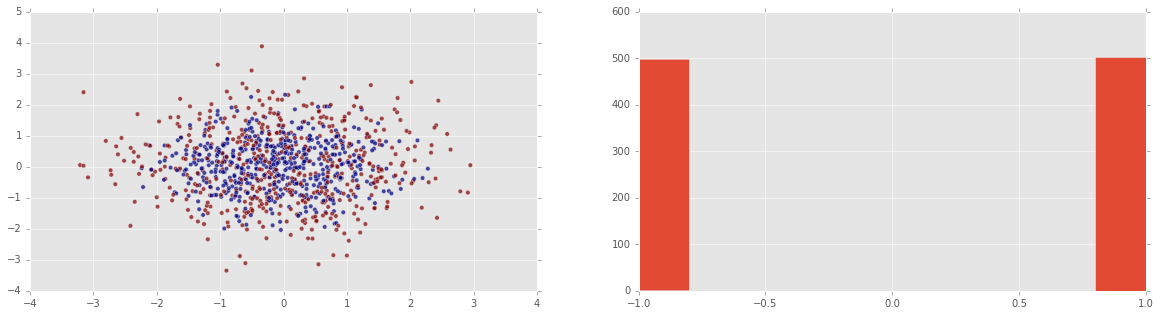


 924
924


 被折叠的 条评论
为什么被折叠?
被折叠的 条评论
为什么被折叠?
 到【灌水乐园】发言


