


从最终输出分析DundasWebChart图形组件设计要点:
1.GDI图形绘制算法;
2.HTML图形热点区域定义;
3.组件设计时支持;
实例分析:一个带立体效果的饼状图
效果如下: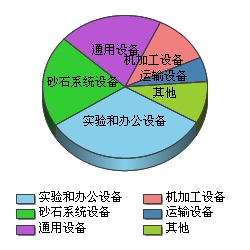
HTML代码如下:
<img id="chartAmountGuide" USEMAP="#chartAmountGuideImageMap" src="ChartPic_000006.jpeg?cf0b9b77-4a9b-4566-a601-85ede8c4c573" _fcksavedurl=""ChartPic_000006.jpeg?cf0b9b77-4a9b-4566-a601-85ede8c4c573"" alt="" border="0" />
<MAP NAME="chartAmountGuideImageMap">
<AREA SHAPE="poly" Title="32.65%" COORDS="124,86,196,122,196,122,191,128,186,134,180,139,174,143,168,147,161,150,153,153,146,155,138,157,130,158,122,158,114,157,106,156,99,154,91,151,83,148,75,143,68,138,61,132,55,125,55,125,124,86">
<AREA SHAPE="poly" Title="20.71%" COORDS="124,86,55,125,55,125,52,119,49,114,46,109,44,103,43,97,42,92,42,86,42,80,43,75,44,69,46,63,49,58,52,53,55,48,59,43,63,38,63,38,124,86">
<AREA SHAPE="poly" Title="9.49%" COORDS="124,86,207,81,207,81,207,86,207,92,206,97,205,102,203,107,201,112,199,117,196,122,196,122,124,86">
<AREA SHAPE="poly" Title="5.58%" COORDS="124,86,200,57,200,57,202,63,204,69,206,75,207,81,207,81,124,86">
<AREA SHAPE="poly" Title="11.21%" COORDS="124,86,160,22,160,22,166,25,172,28,178,32,183,36,188,41,193,46,196,51,200,57,200,57,124,86">
<AREA SHAPE="poly" Title="20.35%" COORDS="124,86,63,38,63,38,68,34,73,30,78,27,84,24,90,21,96,19,102,18,108,16,115,15,121,15,128,15,134,15,141,16,147,18,154,19,160,22,160,22,124,86">
<AREA SHAPE="poly" Title="32.65%" COORDS="196,122,196,134,196,134,191,140,186,146,180,151,174,156,168,160,161,163,153,166,146,168,138,169,130,170,122,170,114,170,106,168,99,166,91,164,83,161,75,156,68,150,61,144,55,137,55,137,55,125,55,125,60,131,65,136,71,141,78,145,84,149,92,152,99,154,107,156,114,157,122,158,130,158,138,157,146,155,154,153,161,150,169,146,177,141,184,136,191,129,196,122">
<AREA SHAPE="poly" Title="20.71%" COORDS="55,125,55,137,55,137,52,133,49,128,47,123,45,119,44,114,43,109,42,104,42,99,42,99,42,86,42,86,42,91,43,96,44,101,45,106,47,111,49,116,52,120,55,125">
<AREA SHAPE="poly" Title="9.49%" COORDS="207,86,207,99,207,99,206,108,204,117,201,126,196,134,196,134,196,122,196,122,201,114,204,105,206,96,207,86">
</MAP>
实例分析:一个带曲线的柱状图
效果如下: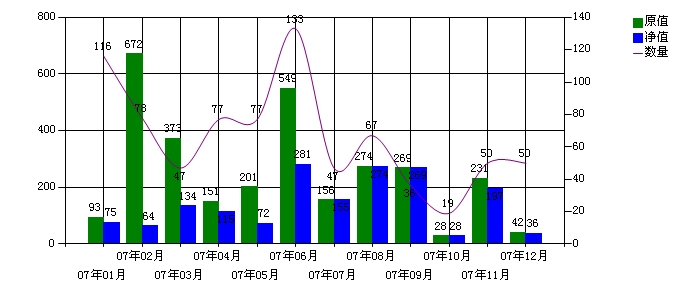
HTML代码如下:
<img id="chartManageDeptGuide" USEMAP="#chartManageDeptGuideImageMap" src="ChartPic_000003.jpeg?d95742e7-3836-4c26-b829-954efdc3c09f" _fcksavedurl=""ChartPic_000003.jpeg?d95742e7-3836-4c26-b829-954efdc3c09f"" alt="" border="0" />
<MAP NAME="chartManageDeptGuideImageMap">
<AREA SHAPE="poly" Title="50" COORDS="486,161,492,159,498,157,509,158,519,160,523,161,523,161,526,161,525,164,522,164,518,163,518,163,509,161,509,161,498,160,498,160,492,162,493,162,488,164">
<AREA SHAPE="poly" Title="50" COORDS="448,212,453,209,453,209,457,204,457,204,462,197,462,197,467,189,467,189,471,180,476,173,481,166,486,162,488,164,483,168,484,168,479,174,479,174,474,182,474,182,469,190,464,198,460,205,455,211,450,214">
<AREA SHAPE="poly" Title="19" COORDS="411,184,421,194,421,194,431,204,431,204,435,208,435,208,440,211,440,210,444,212,444,212,449,211,449,214,444,215,439,213,433,210,429,206,419,197,409,186">
<AREA SHAPE="poly" Title="36" COORDS="373,134,378,136,383,141,388,148,392,156,402,172,402,171,407,179,407,179,411,184,409,186,404,180,399,173,390,157,390,157,385,150,385,150,380,143,381,143,376,139,376,139,371,136">
<AREA SHAPE="poly" Title="67" COORDS="335,166,337,169,337,169,339,170,338,170,341,169,340,170,342,168,342,168,347,163,347,164,352,156,352,156,356,148,361,141,366,135,369,134,372,134,372,137,370,137,370,136,368,138,368,138,363,143,364,142,359,150,359,150,354,158,349,165,344,171,341,172,338,173,335,171,333,169">
<AREA SHAPE="poly" Title="47" COORDS="296,27,299,30,301,35,304,42,306,50,309,60,311,71,316,94,321,117,321,117,323,129,323,129,325,139,325,139,328,148,328,148,330,156,330,156,333,163,333,162,335,167,332,168,330,164,327,157,325,149,323,140,320,129,318,118,313,94,313,94,308,71,308,72,306,61,306,61,303,51,303,51,301,43,301,43,299,36,299,37,296,32,296,32,294,29">
<AREA SHAPE="poly" Title="133" COORDS="256,118,258,115,258,115,260,110,260,110,263,104,263,104,265,97,265,97,270,81,270,81,275,64,279,49,282,42,284,36,287,32,289,28,293,26,295,27,295,30,293,29,294,29,291,30,292,30,289,33,289,33,287,38,287,37,285,43,285,43,282,50,282,50,277,65,277,65,273,82,268,98,265,105,263,111,260,116,258,120">
<AREA SHAPE="poly" Title="77" COORDS="218,117,223,116,228,116,233,118,238,120,238,120,243,122,243,122,247,123,247,123,252,121,251,122,256,118,258,120,253,124,247,126,242,125,237,123,232,121,232,121,228,119,228,119,223,119,224,119,219,120">
<AREA SHAPE="poly" Title="77" COORDS="180,166,184,164,184,165,189,160,188,160,193,153,193,154,198,146,198,146,203,137,208,129,213,122,217,118,220,120,215,124,215,124,210,131,210,131,205,139,205,139,201,147,196,155,191,162,186,167,180,169">
<AREA SHAPE="poly" Title="47" COORDS="143,117,148,124,153,132,162,148,162,148,167,155,167,155,172,161,171,161,176,165,176,165,180,166,180,169,174,167,169,163,164,157,160,150,150,134,145,126,145,126,140,118">
<AREA SHAPE="poly" Title="78" COORDS="105,55,108,60,111,66,111,66,116,74,121,83,121,83,132,101,132,101,138,109,143,117,140,118,135,110,135,110,130,102,119,84,114,76,109,68,105,61,105,61,102,57">
<AREA SHAPE="rect" Title="36.9114" COORDS="525,233,541,243">
<AREA SHAPE="rect" Title="197.3990" COORDS="487,188,502,243">
<AREA SHAPE="rect" Title="28.6790" COORDS="449,235,464,243">
<AREA SHAPE="rect" Title="269.6360" COORDS="410,167,426,243">
<AREA SHAPE="rect" Title="274.4530" COORDS="372,166,387,243">
<AREA SHAPE="rect" Title="155.7511" COORDS="334,199,349,243">
<AREA SHAPE="rect" Title="281.7886" COORDS="295,164,310,243">
<AREA SHAPE="rect" Title="72.1595" COORDS="257,223,272,243">
<AREA SHAPE="rect" Title="115.9814" COORDS="218,211,234,243">
<AREA SHAPE="rect" Title="134.1269" COORDS="180,205,195,243">
<AREA SHAPE="rect" Title="64.6250" COORDS="142,225,157,243">
<AREA SHAPE="rect" Title="75.9138" COORDS="103,222,119,243">
<AREA SHAPE="rect" Title="42" COORDS="510,232,525,243">
<AREA SHAPE="rect" Title="231.22" COORDS="472,178,487,243">
<AREA SHAPE="rect" Title="28.68" COORDS="433,235,449,243">
<AREA SHAPE="rect" Title="269.64" COORDS="395,167,410,243">
<AREA SHAPE="rect" Title="274.45" COORDS="357,166,372,243">
<AREA SHAPE="rect" Title="156.10" COORDS="318,199,334,243">
<AREA SHAPE="rect" Title="549.45" COORDS="280,88,295,243">
<AREA SHAPE="rect" Title="201.67" COORDS="241,186,257,243">
<AREA SHAPE="rect" Title="151.63" COORDS="203,201,218,243">
<AREA SHAPE="rect" Title="373.45" COORDS="165,138,180,243">
<AREA SHAPE="rect" Title="672.03" COORDS="126,53,142,243">
<AREA SHAPE="rect" Title="93.39" COORDS="88,217,103,243">
</MAP>
相关资源:
利用GDI+函数构造图形报表:
http://blog.csdn.net/sharpnessdotnet/archive/2005/01/15/254370.aspx
图形热点说明:
http://htmlhelp.com/reference/wilbur/special/area.html:
This element is also available in our updated HTML 4 reference. Some characteristics may have changed.
Appearance: <AREA SHAPE=x HREF=URL COORDS=string ALT=string>
Attributes: SHAPE=rect|circle|poly, COORDS=string, NOHREF|HREF=URL, ALT=string
Contents: None (Empty).
May occur in: MAP.
Inside the MAP tag, each "hotzone" in the client-side imagemap is defined with an AREA tag. The HREF attribute specifies the URL for the destination that should be chosen if this area was selected. If you specify NOHREF instead, this area won't do anything.
SHAPE and COORDS define the actual region. SHAPE can be a rectangle, circle, or polygon, and COORDS should contain a set of coordinates describing that shape. This is done with a comma separated list of numbers, enclosed in quotes. The syntax for COORDS depends on what shape you choose.
rect - rectangle
A rectangle has four coordinates. The first specifies the top left corner, and the second the bottom right corner of the rectangle. For example, <AREA SHAPE=rect COORDS="0,0,9,9"> would specify a rectangle of 10x10 pixels, starting in the top left corner of the image.
circle - circle
A circle is defined by its center and radius. The COORDS attribute first specifies the coordinates of the center, and then the radius of the circle, in pixels. For example, <AREA SHAPE=circle COORDS="10,10,5"> would specify a circle with radius 5 at location (10,10) in the image.
poly - polygon
A polygon is built up by a list of coordinates. They are all connected in the order you present, and the last coordinate pair is connected to the first. This way you can build arbitrary figures. For example, <AREA SHAPE=poly COORDS="10,50,15,20,20,50"> would specify a triangle, with edge locations (10,50), (15,20) and (20,50).
The ALT text is used by text browsers to present the URLs in the imagemap in a more readable fashion. If you leave those off, the browser can only display the "bare" URLs. The ALT text is required if you want your document to be valid.
Notes:
Coordinates are specified in X,Y order: COORDS="1,0,10,19" means from X=1, Y=0 to X=10, Y=19. The top left corner is (0,0).
If you have an area which should not do anything, use NOHREF.
Just like with IMG, there can be no markup inside the ALT attribute.
组件设计时支持:
http://dotnet.chinaitlab.com/ASPNET/717728.html
Microsoft ASP.NET 为开发人员提供了一种适用于 Web 开发的、功能最为强大的新工具:服务器控件。服务器控件使开发人员能够在短时间内开发出响应速度快而且功能强大的 Web 应用程序,所需的时间与在典型的 ASP 中创建类似应用程序的时间差不多。
ASP.NET 服务器控件之所以能够提供生产效率,关键原因之一在于它为 Microsoft Visual Studio .NET 开发环境中的服务器控件提供了丰富的设计时支持。开发人员可以将服务器控件从 Visual Studio .NET 工具箱拖放到页面上,通过 Properties(属性)窗口访问它们的属性,然后在 Visual Studio HTML 编辑器以及 ASP.NET 页面的内含代码的类中利用 Microsoft IntelliSense语句完成功能。这些设计时功能为 Web 开发带来了快速应用程序开发 (RAD) 工具,而这些工具已被 Microsoft Visual Basic开发人员使用了多年。
ASP.NET 还使开发人员能够通过创建自定义服务器控件以封装大量可重复使用的用户界面特定的代码(例如登录或注册表单),来进一步提高生产效率。尽管开发人员已经开始意识到开发自定义控件的重要性,但许多人可能还没有意识到还能在控件中利用 Visual Studio 设计时支持的强大功能,使这些控件能够像 ASP.NET 中的内置控件那样易于使用。本文将介绍 Microsoft .NET Framework 和 Visual Studio .NET 提供的设计时支持的类型,并向开发人员介绍如何构建利用这种支持的控件。
设计时支持的类型:
针对 Visual Studio .NET 中的服务器控件,有五种不同的设计时支持。它们是:
1、内含代码的类中的 IntelliSense
2、设计视图中的属性浏览器支持
3、工具箱支持
4、HTML 视图中的属性浏览器支持
5、HTML 编辑器中的 IntelliSense
这些设计时支持类型是由几个不同的机制提供的。内含代码的类中的 IntelliSense 由 IDE 启用,IDE 为您的控件读取元数据以确定控件所提供的属性和方法及其类型和参数。要启用内含代码的类中的 IntelliSense,只需对您的控件进行编写和编译,然后将其程序集放到使用该控件的应用程序的 bin 子目录中。
Visual Studio .NET 编辑器设计视图中的属性浏览器支持通过以下两个途径提供:将该类型与某个属性相关联和/或将元数据特性与该属性相关联。将元数据特性(下文简称为特性)添加到您的代码中,用于标识属性的类别、提供属性说明以及在需要时指定首选编辑器。有些类型的属性(如 System.Drawing.Color)会自动映射到 Visual Studio .NET 中的相应编辑器中。
Visual Studio .NET 的 HTML 视图中的 IntelliSense 和属性浏览器支持通过使用一种 XSD 架构进行提供,该架构用于描述与控件相关联的类型,它使用称为 Visual Studio 注释的文本修饰指定控件的首选编辑器和其他首选项。
最后,您可以通过结合特性和带有特定属性的自定义位图来支持从 Visual Studio .NET 工具箱拖放控件。


 1898
1898


 被折叠的 条评论
为什么被折叠?
被折叠的 条评论
为什么被折叠?
 到【灌水乐园】发言


