


ELK stack
ELK stack是又Elasticsearch,lostash,kibana 三个开源软件的组合而成,形成一款强大的实时日志收集分析展示系统。
Logstash:日志收集工具,可以从本地磁盘,网络服务(自己监听端口,接受用户日志),消息队列中收集各种各样的日志,然后进行过滤分析,并将日志输入到Elasticsearch中。
Elasticsearch:日志分布式存储/搜索工具,原生支持集群功能,可以将指定时间的日志生成一个索引,加快日志查询和访问。
Kibana:可视化日志web展示工具,对Elasticsearch中存储的日志进行展示,还可以生成炫丽的仪表盘。
拓扑
110160402215734.png
nginx代理两台Elasticsearch集群,logstash将客户端端日志手到redis,redis将数据传递给es,客户端使用lostash将日志传递给redis
环境
[root@localhost logs]# cat /etc/redhat-release
CentOS release 6.6 (Final)
[root@localhost logs]# uname -rm
2.6.32-504.el6.x86_64 x86_64
[root@localhost logs]#
使用软件
elasticsearch-1.7.4.tar.gz
kibana-4.1.1-linux-x64.tar.gz
logstash-1.5.5.tar.gz
时间同步
ntpdate time.nist.gov
Elasticsearch集群安装配置
一,192.168.1.8下载安装 elasticsearch
yum -y install java-1.8.0 lrzsz git
wget -P /usr/local https://download.elastic.co/elasticsearch/elasticsearch/elasticsearch-1.7.4.tar.gz
cd /usr/local
tar xf elasticsearch-1.7.4.tar.gz
ln -s elasticsearch-1.7.4 elasticsearch
修改配置文件vim elasticsearch/config/elasticsearch.yml
cluster.name: LinuxEA 群集名称
node.name: "linuxEA-ES1" 节点名称
node.master: true 是否为主
node.data: true 是否存储
index.number_of_shards: 5 分片
index.number_of_replicas: 1
path.conf: /usr/local/elasticsearch/config/ 配置文件路径
path.data: /data/es-data date路径
path.work: /data/es-worker
path.logs: /usr/local/elasticsearch/logs/ 日志
path.plugins: /usr/local/elasticsearch/plugins 模块
bootstrap.mlockall: true 不写入内存
network.host: 192.168.1.8
http.port: 9200
创建目录
mkdir /data/es-data -p
mkdir /data/es-worker -p
mkdir /usr/local/elasticsearch/logs
mkdir /usr/local/elasticsearch/plugins
下载启动配置文件
git clone https://github.com/elastic/elasticsearch-servicewrapper.git
mv elasticsearch-servicewrapper/service/ /usr/local/elasticsearch/bin/
/usr/local/elasticsearch/bin/service/elasticsearch install
修改配置文件
vim /usr/local/elasticsearch/bin/service/elasticsearch.conf
set.default.ES_HOME=/usr/local/elasticsearch #设置ES的安装路径,必须和安装路径保持一直
set.default.ES_HEAP_SIZE=1024
启动
[root@elk1 local]# /etc/init.d/elasticsearch start
Starting Elasticsearch...
Waiting for Elasticsearch......
running: PID:4355
[root@elk1 local]# netstat -tlntp|grep -E "9200|9300"
tcp 0 0 ::ffff:192.168.1.8:9300 :::* LISTEN 4357/java
tcp 0 0 ::ffff:192.168.1.8:9200 :::* LISTEN 4357/java
[root@elk1 local]#
curl
[root@elk1 local]# curl http://192.168.1.8:9200
{
"status" : 200,
"name" : "linuxEA-ES1",
"cluster_name" : "LinuxEA",
"version" : {
"number" : "1.7.4",
"build_hash" : "0d3159b9fc8bc8e367c5c40c09c2a57c0032b32e",
"build_timestamp" : "2015-12-15T11:25:18Z",
"build_snapshot" : false,
"lucene_version" : "4.10.4"
},
"tagline" : "You Know, for Search"
}
[root@elk1 local]#
Elasticsearch2
二,192.168.1.7 Elasticsearch2
[root@elk2 local]# vim elasticsearch/config/elasticsearch.yml
cluster.name: LinuxEA
node.name: "linuxEA-ES2"
node.master: true
node.data: true
index.number_of_shards: 5
index.number_of_replicas: 1
path.conf: /usr/local/elasticsearch/config/
path.data: /data/es-data
path.work: /data/es-worker
path.logs: /usr/local/elasticsearch/logs/
path.plugins: /usr/local/elasticsearch/plugins
bootstrap.mlockall: true
network.host: 192.168.1.7
http.port: 9200
创建目录
mkdir /data/es-data -p
mkdir /data/es-worker -p
mkdir /usr/local/elasticsearch/logs
mkdir /usr/local/elasticsearch/plugins
下载启动配置文件
git clone https://github.com/elastic/elasticsearch-servicewrapper.git
mv elasticsearch-servicewrapper/service/ /usr/local/elasticsearch/bin/
/usr/local/elasticsearch/bin/service/elasticsearch install
修改配置文件
vim /usr/local/elasticsearch/bin/service/elasticsearch.conf
set.default.ES_HOME=/usr/local/elasticsearch #设置ES的安装路径,必须和安装路径保持一直
set.default.ES_HEAP_SIZE=1024
启动
[root@elk2 local]# /etc/init.d/elasticsearch start
Starting Elasticsearch...
Waiting for Elasticsearch......
running: PID:4355
[root@elk2 ~]# netstat -tlntp|grep -E "9200|9300"
tcp 0 0 ::ffff:192.168.1.7:9300 :::* LISTEN 4568/java
tcp 0 0 ::ffff:192.168.1.7:9200 :::* LISTEN 4568/java
[root@elk2 ~]#
curl
[root@elk2 ~]# curl http://192.168.1.7:9200
{
"status" : 200,
"name" : "linuxEA-ES2",
"cluster_name" : "LinuxEA",
"version" : {
"number" : "1.7.4",
"build_hash" : "0d3159b9fc8bc8e367c5c40c09c2a57c0032b32e",
"build_timestamp" : "2015-12-15T11:25:18Z",
"build_snapshot" : false,
"lucene_version" : "4.10.4"
},
"tagline" : "You Know, for Search"
}
[root@elk2 ~]#
集群插件elasticsearch-head
三,192.168.1.7 elasticsearch-head安装 五星表示主节点,原点表示工作节点
[root@elk2 ~]# /usr/local/elasticsearch/bin/plugin -i mobz/elasticsearch-head
12.png
redis+logstash
四,192.168.1.6安装redis+logstash,主要用于将redis数据传递到es
安装java依赖包
yum -y install java-1.8.0 lrzsz git
wget -P /usr/local https://download.elastic.co/logstash/logstash/logstash-1.5.5.tar.gz
cd /usr/local
tar xf logstash-1.5.5.tar.gz
ln -s logstash-1.5.5 logstash
启动脚本
[root@localhost local]# vim /etc/init.d/logstash
#!/bin/sh
# Init script for logstash
# Maintained by Elasticsearch
# Generated by pleaserun.
# Implemented based on LSB Core 3.1:
# * Sections: 20.2, 20.3
#
### BEGIN INIT INFO
# Provides: logstash
# Required-Start: $remote_fs $syslog
# Required-Stop: $remote_fs $syslog
# Default-Start: 2 3 4 5
# Default-Stop: 0 1 6
# Short-Description:
# Description: Starts Logstash as a daemon.
### END INIT INFO
PATH=/sbin:/usr/sbin:/bin:/usr/bin
export PATH
if [ `id -u` -ne 0 ]; then
echo "You need root privileges to run this script"
exit 1
fi
name=logstash
pidfile="/var/run/$name.pid"
export CLASSPATH=.:$JAVA_HOME/jre/lib/rt.jar:$JAVA_HOME/lib/dt.jar:$JAVA_HOME/lib/tools.jar
export PATH=$PATH:$JAVA_HOME/bin
LS_USER=logstash
LS_GROUP=logstash
LS_HOME=/usr/local/logstash
LS_HEAP_SIZE="500m"
LS_JAVA_OPTS="-Djava.io.tmpdir=${LS_HOME}"
LS_LOG_DIR=/usr/local/logstash
LS_LOG_FILE="${LS_LOG_DIR}/$name.log"
LS_CONF_FILE=/etc/logstash.conf
LS_OPEN_FILES=16384
LS_NICE=19
LS_OPTS=""
[ -r /etc/default/$name ] && . /etc/default/$name
[ -r /etc/sysconfig/$name ] && . /etc/sysconfig/$name
program=/usr/local/logstash/bin/logstash
args="agent -f ${LS_CONF_FILE} -l ${LS_LOG_FILE} ${LS_OPTS}"
start() {
JAVA_OPTS=${LS_JAVA_OPTS}
HOME=${LS_HOME}
export PATH HOME JAVA_OPTS LS_HEAP_SIZE LS_JAVA_OPTS LS_USE_GC_LOGGING
# set ulimit as (root, presumably) first, before we drop privileges
ulimit -n ${LS_OPEN_FILES}
# Run the program!
nice -n ${LS_NICE} sh -c "
cd $LS_HOME
ulimit -n ${LS_OPEN_FILES}
exec \"$program\" $args
" > "${LS_LOG_DIR}/$name.stdout" 2> "${LS_LOG_DIR}/$name.err" &
# Generate the pidfile from here. If we instead made the forked process
# generate it there will be a race condition between the pidfile writing
# and a process possibly asking for status.
echo $! > $pidfile
echo "$name started."
return 0
}
stop() {
# Try a few times to kill TERM the program
if status ; then
pid=`cat "$pidfile"`
echo "Killing $name (pid $pid) with SIGTERM"
kill -TERM $pid
# Wait for it to exit.
for i in 1 2 3 4 5 ; do
echo "Waiting $name (pid $pid) to die..."
status || break
sleep 1
done
if status ; then
echo "$name stop failed; still running."
else
echo "$name stopped."
fi
fi
}
status() {
if [ -f "$pidfile" ] ; then
pid=`cat "$pidfile"`
if kill -0 $pid > /dev/null 2> /dev/null ; then
# process by this pid is running.
# It may not be our pid, but that's what you get with just pidfiles.
# TODO(sissel): Check if this process seems to be the same as the one we
# expect. It'd be nice to use flock here, but flock uses fork, not exec,
# so it makes it quite awkward to use in this case.
return 0
else
return 2 # program is dead but pid file exists
fi
else
return 3 # program is not running
fi
}
force_stop() {
if status ; then
stop
status && kill -KILL `cat "$pidfile"`
fi
}
case "$1" in
start)
status
code=$?
if [ $code -eq 0 ]; then
echo "$name is already running"
else
start
code=$?
fi
exit $code
;;
stop) stop ;;
force-stop) force_stop ;;
status)
status
code=$?
if [ $code -eq 0 ] ; then
echo "$name is running"
else
echo "$name is not running"
fi
exit $code
;;
restart)
stop && start
;;
reload)
stop && start
;;
*)
echo "Usage: $SCRIPTNAME {start|stop|force-stop|status|restart}" >&2
exit 3
;;
esac
exit $?
开机启动
[root@localhost local]# chmod +X /etc/init.d/logstash
chkconfig --add logstash
chkconfig logstash on
1,编辑logstash配置文件
[root@localhost local]# vim /etc/logstash.conf
input { #表示从标准输入中收集日志
stdin {}
}
output {
elasticsearch { #表示将日志输出到ES中
host => ["172.16.4.102:9200","172.16.4.103:9200"] #可以指定多台主机,也可以指定集群中的单台主机
protocol => "http"
}
}
2.手动写入数据
[root@localhost local]# /usr/local/logstash/bin/logstash -f /etc/logstash.conf
Logstash startup completed
hello word!
3.写入完成,查看ES中已经写入,并自动建立一个索引
13.png
4.redis
1,安装redis
yum -y install redis
vim /etc/redis.conf
bind 192.168.1.6
/etc/init.d/redis start
2,安装logstash,如上即可
3,logstash+redis
logstash来读取redis内容到es
cat /etc/logstash.conf
input {
redis {
host => "192.168.1.6"
data_type => "list"
key => "nginx-access.log"
port => "6379"
db => "2"
}
}
output {
elasticsearch {
host => ["192.168.1.7:9200","192.168.1.8:9200"]
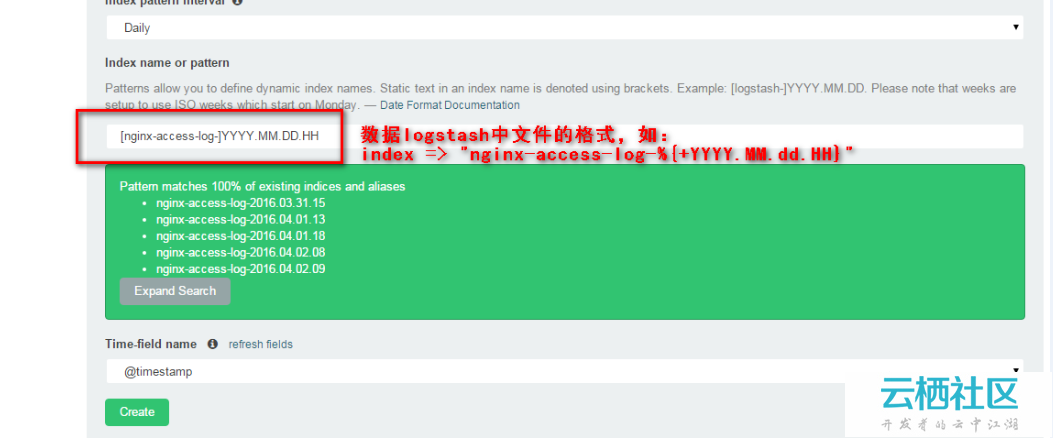
index => "nginx-access-log-%{+YYYY.MM.dd}"
protocol => "http"
workers => 5
template_overwrite => true
}
}
nginx+logstash示例
五,192.168.1.4 安装logstash和nginx,logstash将nginx数据传递到redis即可
logstash如第四步安装即可
yum -y install pcre pcre-devel openssl-devel oepnssl
http://nginx.org/download/nginx-1.6.3.tar.gz
groupadd -r nginx
useradd -g nginx -r nginx
ln -s /usr/local/nginx-1.6.3 /usr/local/nginx
编译安装
./configure \
--prefix=/usr/local/nginx \
--conf-path=/etc/nginx/nginx.conf \
--user=nginx --group=nginx \
--error-log-path=/var/log/nginx/error.log \
--http-log-path=/var/log/nginx/access.log \
--pid-path=/var/run/nginx/nginx.pid \
--lock-path=/var/lock/nginx.lock \
--with-http_ssl_module \
--with-http_stub_status_module \
--with-http_gzip_static_module \
--with-http_flv_module \
--with-http_mp4_module \
--http-client-body-temp-path=/var/tmp/nginx/client \
--http-proxy-temp-path=/var/tmp/nginx/proxy \
--http-fastcgi-temp-path=/var/tmp/nginx/fastcgi \
--http-uwsgi-temp-path=/var/tmp/nginx/uwsgi
make && make install
mkdir -pv /var/tmp/nginx/{client,fastcgi,proxy,uwsgi}
mkdir /usr/local/nginx/logs/
/usr/local/nginx/sbin/nginx
修改日志格式vim /etc/nginx/nginx.conf
log_format logstash_json '{"@timestamp":"$time_iso8601",'
'"host": "$server_addr",'
'"client": "$remote_addr",'
'"size": $body_bytes_sent,'
'"responsetime": $request_time,'
'"domain": "$host",'
'"url":"$uri",'
'"referer": "$http_referer",'
'"agent": "$http_user_agent",'
'"status":"$status"}';
access_log logs/access_json.access.log logstash_json;
日志已经生成
[root@localhost nginx]# ll logs/
total 8
-rw-r--r--. 1 root root 6974 Mar 31 08:44 access_json.access.log
日志格式已经被修改好
[root@localhost nginx]# cat /usr/local/nginx/logs/access_json.access.log
{"@timestamp":"2016-03-31T08:44:48-07:00","host": "192.168.1.4","client": "192.168.1.200","size": 0,"responsetime": 0.000,"domain": "192.168.1.4","url":"/index.html","referer": "-","agent": "Mozilla/5.0 (Windows NT 6.1; WOW64) AppleWebKit/537.36 (KHTML, like Gecko) Chrome/47.0.2526.80 Safari/537.36","status":"304"}
{"@timestamp":"2016-03-31T08:44:48-07:00","host": "192.168.1.4","client": "192.168.1.200","size": 0,"responsetime": 0.000,"domain": "192.168.1.4","url":"/index.html","referer": "-","agent": "Mozilla/5.0 (Windows NT 6.1; WOW64) AppleWebKit/537.36 (KHTML, like Gecko) Chrome/47.0.2526.80 Safari/537.36","status":"304"}
{"@timestamp":"2016-03-31T08:44:48-07:00","host": "192.168.1.4","client": "192.168.1.200","size": 0,"responsetime": 0.000,"domain": "192.168.1.4","url":"/index.html","referer": "-","agent": "Mozilla/5.0 (Windows NT 6.1; WOW64) AppleWebKit/537.36 (KHTML, like Gecko) Chrome/47.0.2526.80 Safari/537.36","status":"304"}
将nginx日志传递给redis
[root@elk1 logs]# cat /etc/logstash.conf
input {
file {
path => "/usr/local/nginx/logs/access_json.access.log"
codec => "json"
}
}
output {
redis {
host => "192.168.1.6"
data_type => "list"
key => "nginx-access.log"
port => "6379"
db => "2"
}
}
[root@elk1 logs]#
分别在redis上,和nginx上启动logstash
nohup /usr/local/logstash/bin/logstash -f /etc/logstash.conf
el+kibana
六,192.168.1.7 el+kibana
wget https://download.elastic.co/kibana/kibana/kibana-4.1.1-linux-x64.tar.gz
tar xf kibana-4.1.1-linux-x64.tar.gz
ln -sv kibana-4.1.1-linux-x64 kibana
vim /usr/local/kibana/config/kibana.yml
elasticsearch_url: "http://192.168.1.7:9200"
pid_file: /var/run/kibana.pid
log_file: /usr/local/kibana/kibana.log
nohup ./kibana/bin/kibana &
192.168.1.8 el+kibana
wget https://download.elastic.co/kibana/kibana/kibana-4.1.1-linux-x64.tar.gz
tar xf kibana-4.1.1-linux-x64.tar.gz
ln -sv kibana-4.1.1-linux-x64 kibana
vim /usr/local/kibana/config/kibana.yml
elasticsearch_url: "http://192.168.1.8:9200"
pid_file: /var/run/kibana.pid
log_file: /usr/local/kibana/kibana.log
nohup ./kibana/bin/kibana &
14.png
nginx代理
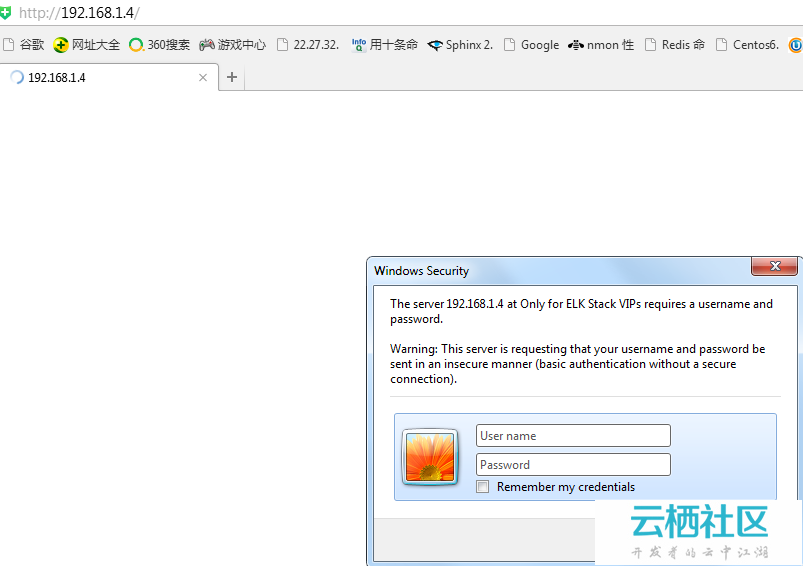
七,192.168.1.200 Nginx反向代理el+kibana(192.168.1.7和192.168.1.8)
基于账户和IP做控制
auth_basic "Only for VIPs";
#定义名称
auth_basic_user_file /etc/nginx/users/.htpasswd;
#定义控制用户名的文件路径,为隐藏文件
}
deny 172.16.0.1;#拒绝172.16.0.1访问,允许便是allow
#比如,只允许172.16.0.1,其他拒绝:
allow 172.16.0.1/16; deny all;
如下:
[root@localhost nginx]# vim nginx.conf
worker_processes 1;
events {
worker_connections 1024;
}
http {
include mime.types;
default_type application/octet-stream;
log_format logstash_json '{"@timestamp":"$time_iso8601",'
'"host": "$server_addr",'
'"client": "$remote_addr",'
'"size": $body_bytes_sent,'
'"responsetime": $request_time,'
'"domain": "$host",'
'"url":"$uri",'
'"referer": "$http_referer",'
'"agent": "$http_user_agent",'
'"status":"$status"}';
access_log logs/access_json.access.log logstash_json;
sendfile on;
keepalive_timeout 65;
upstream kibana { #定义后端主机组
server 192.168.1.8:5601 weight=1 max_fails=2 fail_timeout=2;
server 192.168.1.7:5601 weight=1 max_fails=2 fail_timeout=2;
}
server {
listen 80;
server_name localhost;
auth_basic "Only for ELK Stack VIPs"; #basic
auth_basic_user_file /etc/nginx/.htpasswd; #用户认证密码文件位置
allow 192.168.1.200; #允许192.168.1.200
allow 192.168.1.0/24; #允许192.168.1.0网段
allow 10.0.0.1; #允许10.0.0.1
allow 10.0.0.254; #允许10.0.0.254
deny all; #拒绝所有
location / { #定义反向代理,将访问自己的请求,都转发到kibana服务器
proxy_pass http://kibana/;
index index.html index.htm;
}
}
}
修改权限
[root@localhost nginx]# chmod 400 /etc/nginx/.htpasswd
[root@localhost nginx]# chown nginx. /etc/nginx/.htpasswd
[root@localhost nginx]# cat /etc/nginx/.htpasswd
linuxea:$apr1$EGCdQ5wx$bD2CwXgww3y/xcCjVBcCD0
[root@localhost nginx]#
添加用户和密码
[root@localhost ~]# htpasswd -c -m /etc/nginx/.htpasswd linuxea
New password:
Re-type new password:
Adding password for user linuxea
[root@localhost ~]#
现在就可以用192.168.1.4访问,这里收集的就是代理nginx自己的日志
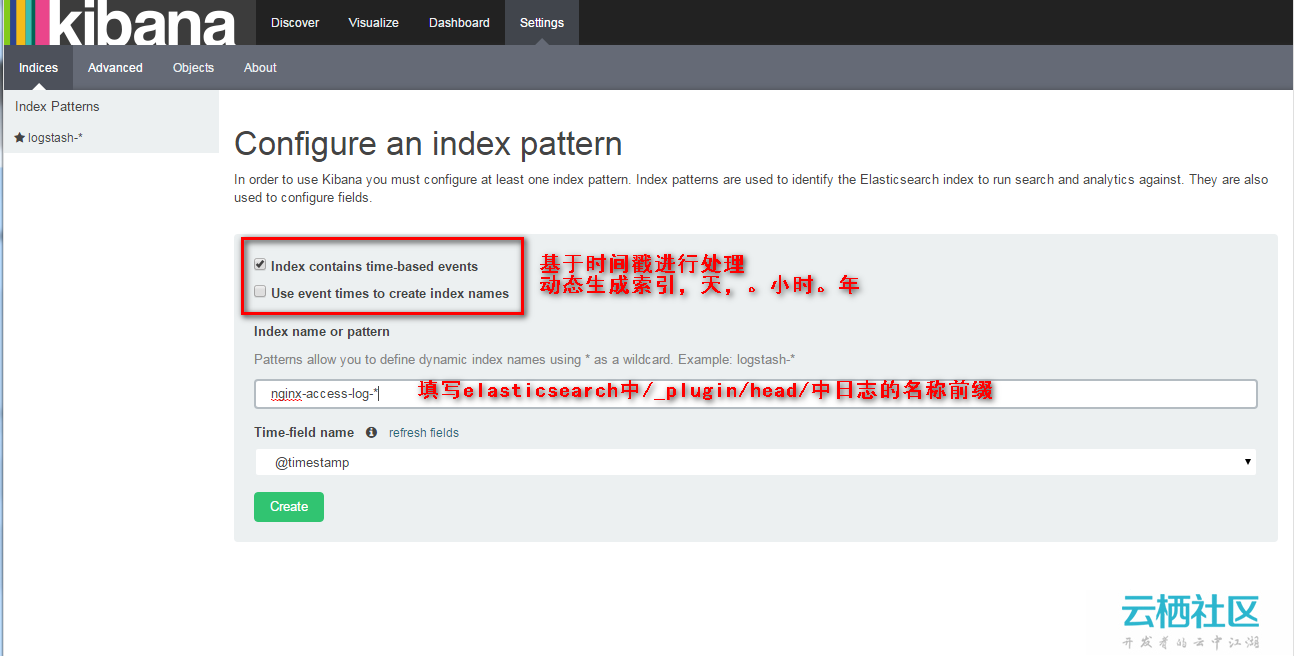
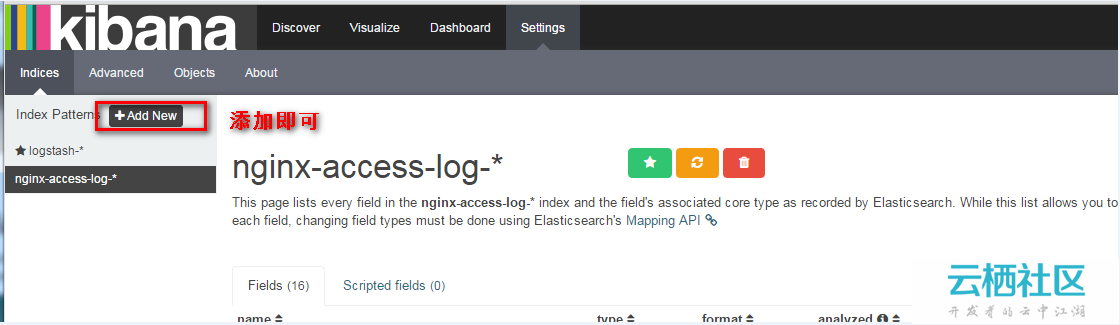
- kibana
打开后,点击settings,add,这里的名称需要遵循固定格式YYYY.MM.DD,日志名称可在http://IP:9200/_plugin/head/查看即可
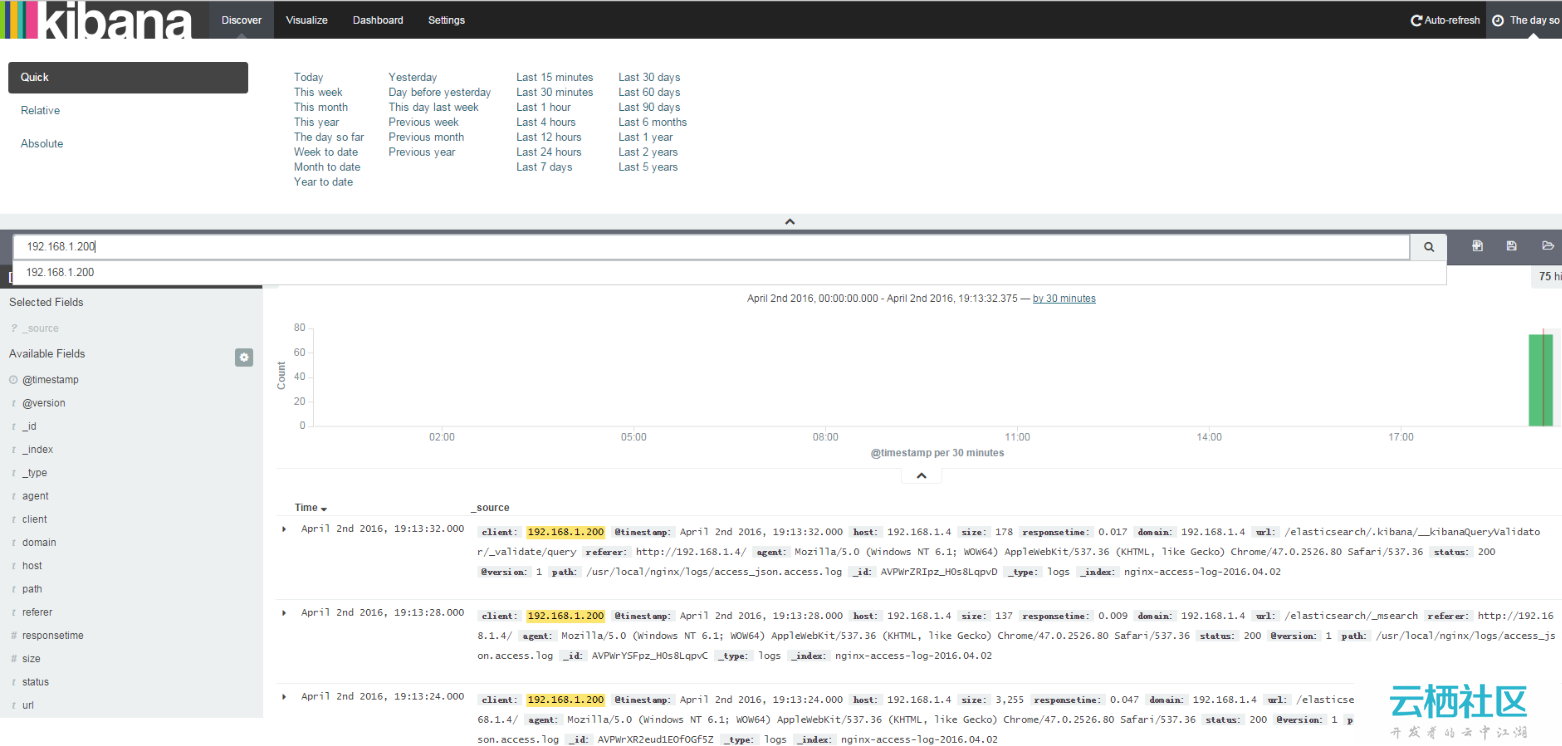
如:搜索ip段:
status:200 AND hosts:192.168.1.200
status:200 OR status:400
status:[400 TO 499]
如果你有多个你可以输入后,会自动索引出来,而后create即可
如果有多个log +add new即可
而后选择discover,选择合适的时间
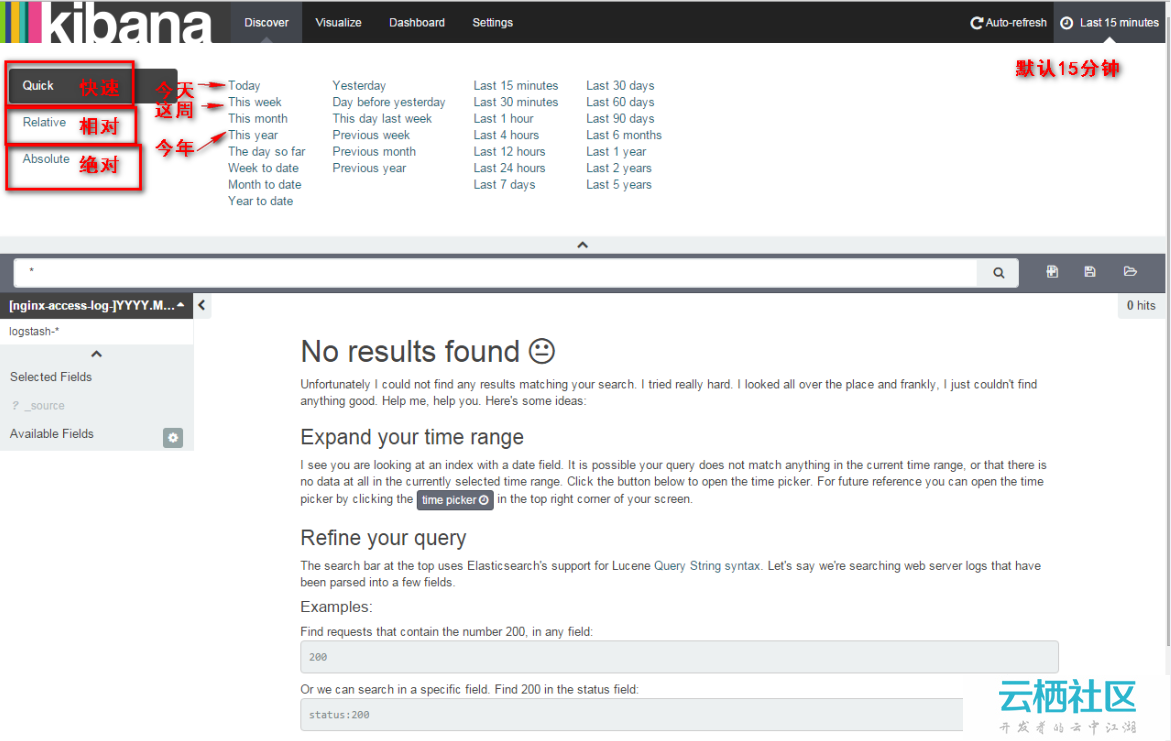
你可以根据想要的结果而输入对应的字段搜索
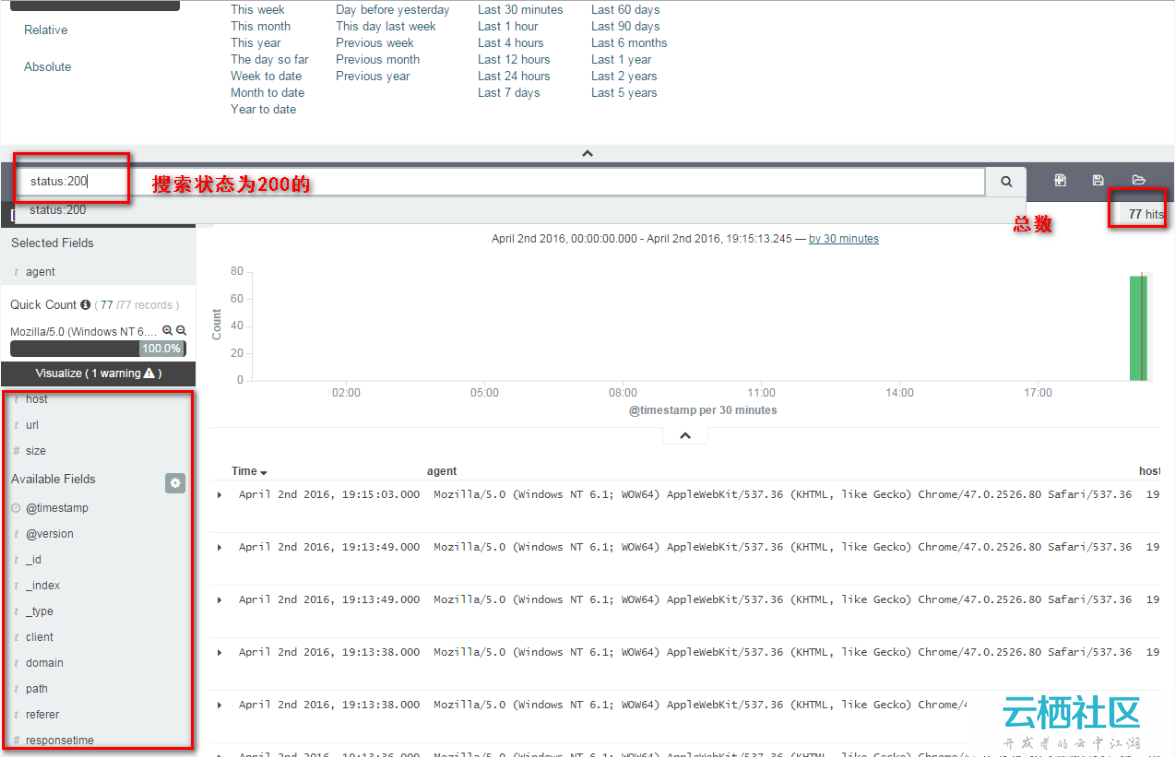
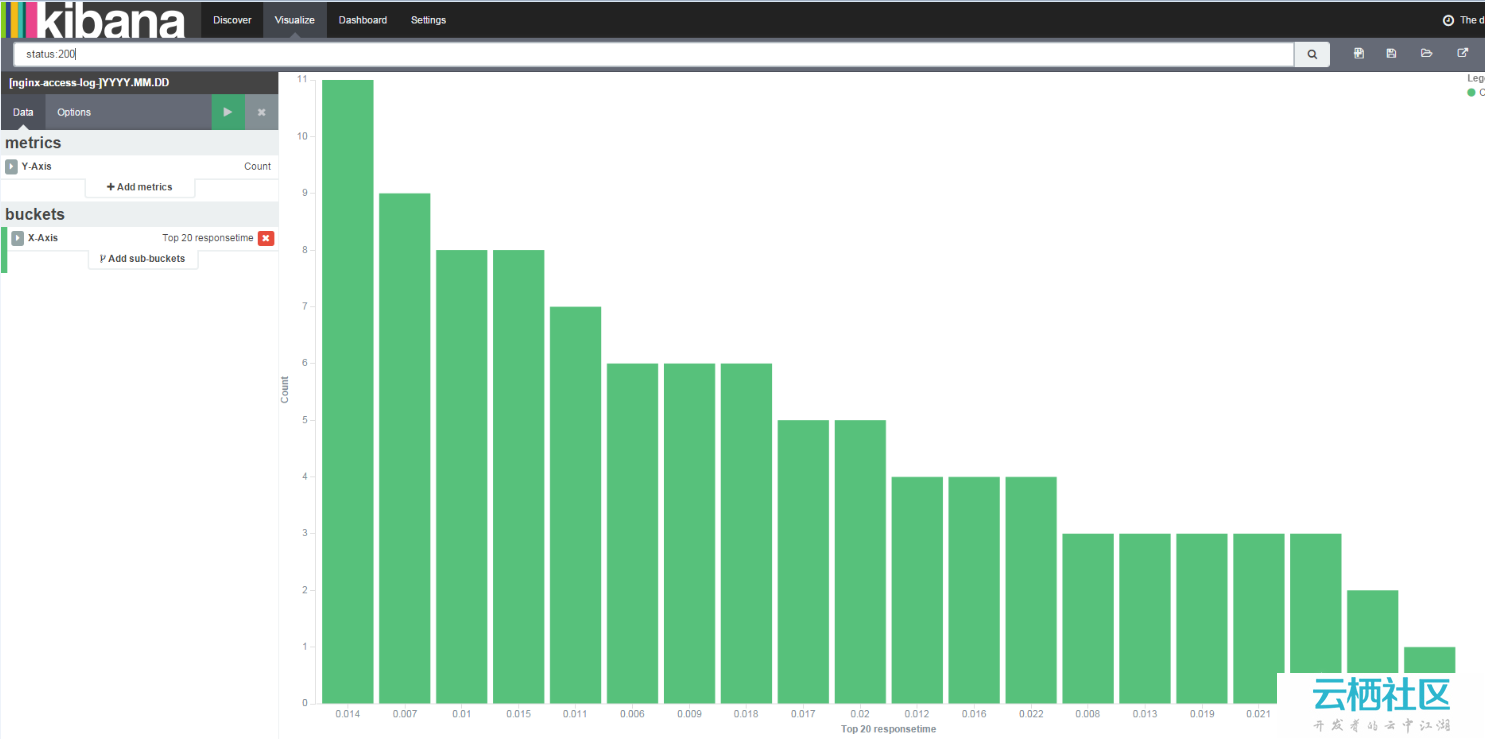
点击visualize选择对应内容,出图
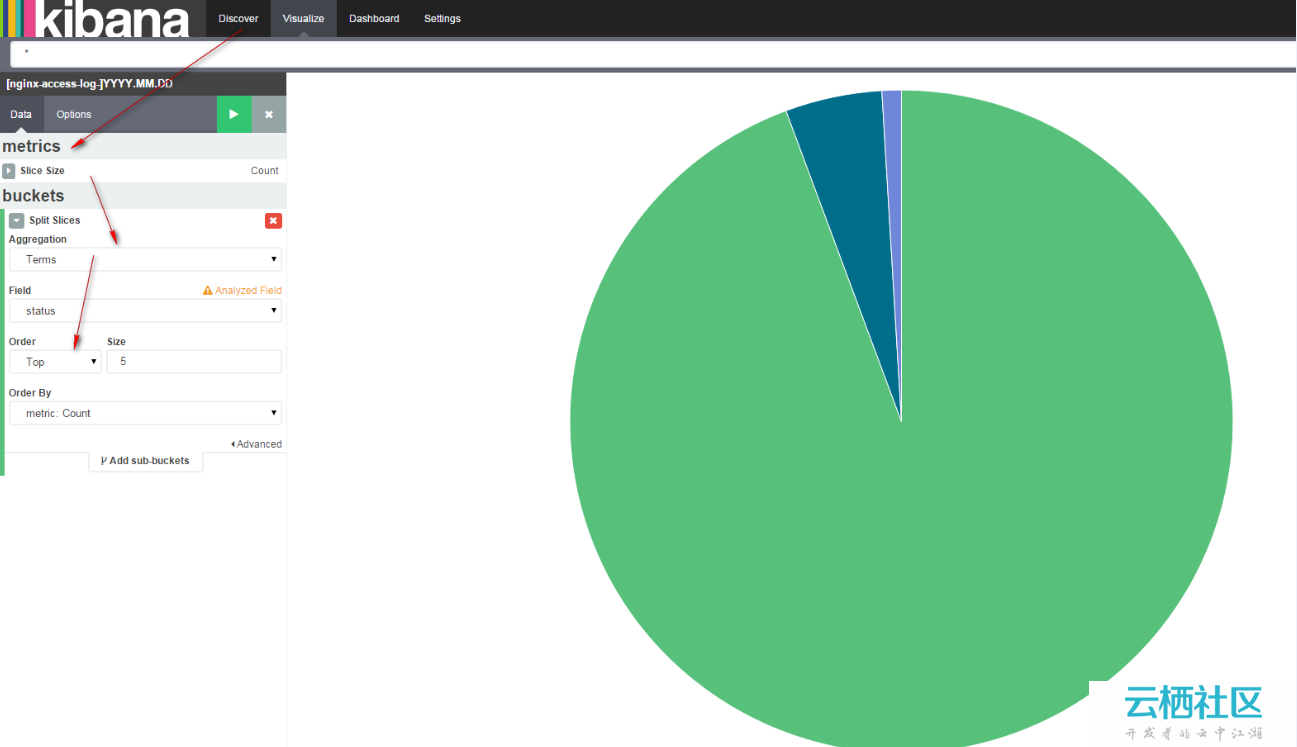
也可以在discover界面选择,点击visualize
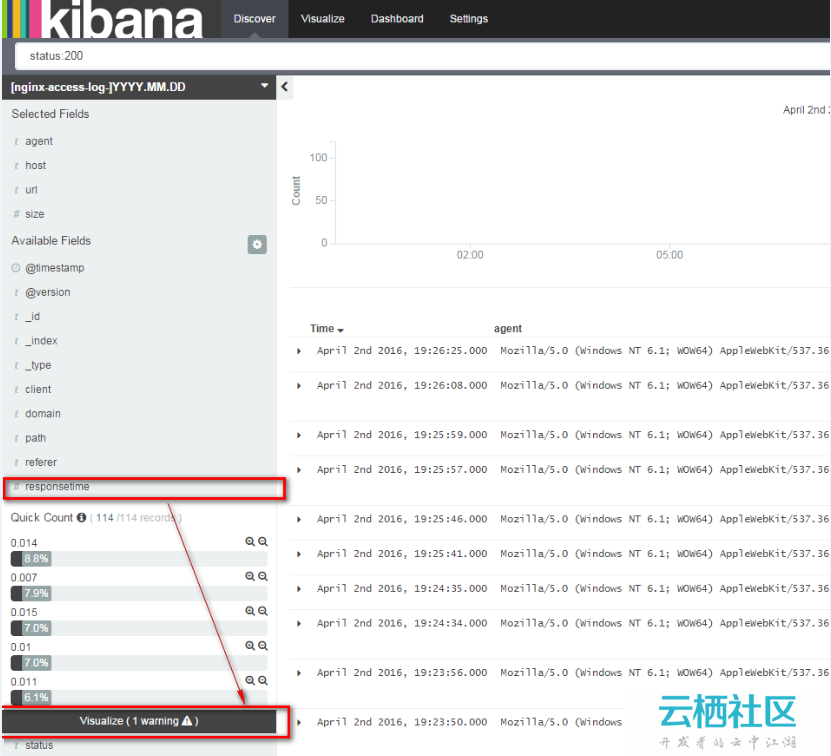
如下
一台机器有多个日志收集,通过if,kye,db区分
input {
file {
type => "apache"
path => "/date/logs/access.log"
}
file {
type => "php-error.log"
path => "/data/logs/php-error.log"
}
}
output {
if [type] == "apache"
redis {
host => "192.168.1.6"
port => "6379"
db => "1"
data_type => "list"
key => "access.log"
}
}
if [type] == "php-error.log"
redis {
host => "192.168.1.6"
port => "6379"
db => "2"
data_type => "list"
key => "php-error.log"
}
}
http://pan.baidu.com/share/init?shareid=570693003&uk=1074693321
密码pe2n


 1793
1793


 被折叠的 条评论
为什么被折叠?
被折叠的 条评论
为什么被折叠?
 到【灌水乐园】发言


