


下载jCharts jar包,网络上经常下载需要登录或者无法访问国外网站的情况,这里我给大家把源码包提供技术下。
下载请移步:http://download.csdn.net/detail/sl0007/6576101
/***********************************************************************************************
* File Info: $Id: BarChartServlet.java,v 1.5 2003/04/19 01:41:27 nathaniel_auvil Exp $
* Copyright (C) 2002
* Author: Nathaniel G. Auvil
* Contributor(s):
*
* Copyright 2002 (C) Nathaniel G. Auvil. All Rights Reserved.
*
* Redistribution and use of this software and associated documentation ("Software"), with or
* without modification, are permitted provided that the following conditions are met:
*
* 1. Redistributions of source code must retain copyright statements and notices.
* Redistributions must also contain a copy of this document.
*
* 2. Redistributions in binary form must reproduce the above copyright notice, this list of
* conditions and the following disclaimer in the documentation and/or other materials
* provided with the distribution.
*
* 3. The name "jCharts" or "Nathaniel G. Auvil" must not be used to endorse or promote
* products derived from this Software without prior written permission of Nathaniel G.
* Auvil. For written permission, please contact nathaniel_auvil@users.sourceforge.net
*
* 4. Products derived from this Software may not be called "jCharts" nor may "jCharts" appear
* in their names without prior written permission of Nathaniel G. Auvil. jCharts is a
* registered trademark of Nathaniel G. Auvil.
*
* 5. Due credit should be given to the jCharts Project (http://jcharts.sourceforge.net/).
*
* THIS SOFTWARE IS PROVIDED BY Nathaniel G. Auvil AND CONTRIBUTORS ``AS IS'' AND ANY
* EXPRESSED OR IMPLIED WARRANTIES, INCLUDING, BUT NOT LIMITED TO, THE IMPLIED WARRANTIES OF
* MERCHANTABILITY AND FITNESS FOR A PARTICULAR PURPOSE ARE DISCLAIMED. IN NO EVENT SHALL
* jCharts OR ITS CONTRIBUTORS BE LIABLE FOR ANY DIRECT, INDIRECT, INCIDENTAL, SPECIAL,
* EXEMPLARY, OR CONSEQUENTIAL DAMAGES (INCLUDING, BUT NOT LIMITED TO, PROCUREMENT OF
* SUBSTITUTE GOODS OR SERVICES; LOSS OF USE, DATA, OR PROFITS; OR BUSINESS INTERRUPTION)
* HOWEVER CAUSED AND ON ANY THEORY OF LIABILITY, WHETHER IN CONTRACT,STRICT LIABILITY, OR TORT
* (INCLUDING NEGLIGENCE OR OTHERWISE) ARISING IN ANY WAY OUT OF THE USE OF THIS SOFTWARE, EVEN
* IF ADVISED OF THE POSSIBILITY OF SUCH DAMAGE
************************************************************************************************/
package com.jiuxing.mobile;
import java.awt.Color;
import java.awt.Font;
import java.awt.Paint;
import java.io.IOException;
import javax.servlet.ServletException;
import javax.servlet.http.HttpServlet;
import javax.servlet.http.HttpServletRequest;
import javax.servlet.http.HttpServletResponse;
import org.krysalis.jcharts.axisChart.AxisChart;
import org.krysalis.jcharts.axisChart.customRenderers.axisValue.renderers.ValueLabelPosition;
import org.krysalis.jcharts.axisChart.customRenderers.axisValue.renderers.ValueLabelRenderer;
import org.krysalis.jcharts.chartData.AxisChartDataSet;
import org.krysalis.jcharts.chartData.DataSeries;
import org.krysalis.jcharts.chartData.interfaces.IAxisDataSeries;
import org.krysalis.jcharts.encoders.ServletEncoderHelper;
import org.krysalis.jcharts.properties.AxisProperties;
import org.krysalis.jcharts.properties.BarChartProperties;
import org.krysalis.jcharts.properties.ChartProperties;
import org.krysalis.jcharts.properties.DataAxisProperties;
import org.krysalis.jcharts.properties.LegendProperties;
import org.krysalis.jcharts.properties.PropertyException;
import org.krysalis.jcharts.properties.util.ChartFont;
import org.krysalis.jcharts.types.ChartType;
public class BarChartServlet extends HttpServlet {
// ---all of my charts serviced by this Servlet will have the same properties.
private BarChartProperties barChartProperties;
// ---all of my charts serviced by this Servlet will have the same properties.
protected LegendProperties legendProperties;
protected AxisProperties axisProperties;
protected ChartProperties chartProperties;
protected int width = 950;
protected int height = 360;
/**********************************************************************************************
*
**********************************************************************************************/
public void init() {
this.legendProperties = new LegendProperties();
this.chartProperties = new ChartProperties();
// 图形的XY轴的属性对象
this.axisProperties = new AxisProperties(false);
// 图表横坐标和纵坐标范围的字体,大小,颜色设置对象
ChartFont axisScaleFont = new ChartFont(new Font(
"Georgia Negreta cursiva", Font.PLAIN, 13), new Color(18, 189,
255));
axisProperties.getXAxisProperties().setScaleChartFont(axisScaleFont);
axisProperties.getYAxisProperties().setScaleChartFont(axisScaleFont);
// Bar图形的横坐标和纵坐标的标题字体和颜色 ,大小的设置对象
ChartFont axisTitleFont = new ChartFont(new Font("Arial Narrow",
Font.PLAIN, 14), new Color(18, 189, 255));
axisProperties.getXAxisProperties().setTitleChartFont(axisTitleFont);
axisProperties.getXAxisProperties().setShowEndBorder(false);
axisProperties.getYAxisProperties().setTitleChartFont(axisTitleFont);
axisProperties.getYAxisProperties().setShowEndBorder(false);
DataAxisProperties dataAxisProperties = (DataAxisProperties) axisProperties
.getYAxisProperties();
try {
// 设置用户定义的纵轴纵坐标的 间隔范围
dataAxisProperties.setUserDefinedScale(0, 3000);
} catch (PropertyException propertyException) {
propertyException.printStackTrace();
}
dataAxisProperties.setRoundToNearest(3);
// 设置图形标题的字体,颜色,大小
ChartFont titleFont = new ChartFont(new Font("Georgia Negreta cursiva",
Font.PLAIN, 14), new Color(18, 189, 255));
// 生成图像的属性对象
this.chartProperties.setTitleFont(titleFont);
// Bar图形的属性类
this.barChartProperties = new BarChartProperties();
ValueLabelRenderer valueLabelRenderer = new ValueLabelRenderer(false,
false, true, -1);
valueLabelRenderer.setValueLabelPosition(ValueLabelPosition.ON_TOP);
// 是否设置显示的纵坐标标签垂直,true为是,flase为水平
valueLabelRenderer.useVerticalLabels(true);
barChartProperties.addPostRenderEventListener(valueLabelRenderer);
}
/**********************************************************************************************
*
**********************************************************************************************/
public void service(HttpServletRequest req,
HttpServletResponse httpServletResponse) throws ServletException,
IOException {
try {
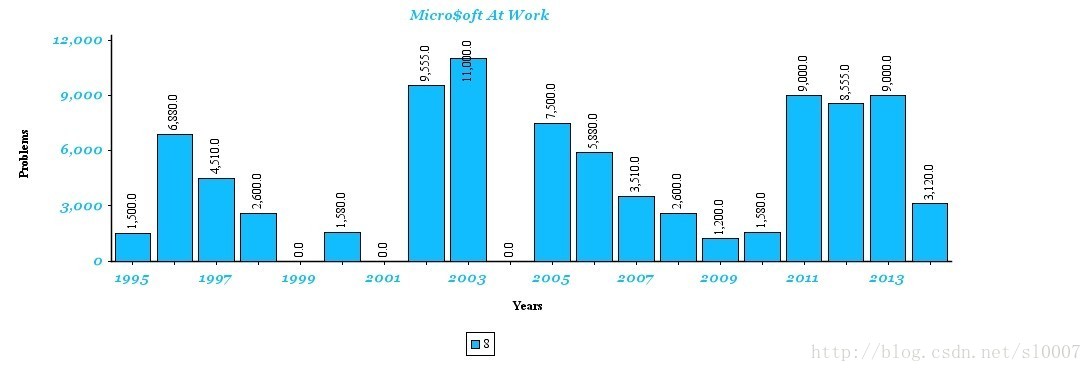
// 设置横坐标标签
String[] xAxisLabels = { "1995", "1996", "1997", "1998", "1999",
"2000", "2001", "2002", "2003", "2004", "2005", "2006",
"2007", "2008", "2009", "2010", "2011", "2012", "2013",
"2014" };
// 设置横坐标的单位
String xAxisTitle = "Years";
// 设置纵坐标的标题
String yAxisTitle = "Problems";
// 设置图形的标题
String title = "Micro$oft At Work";
// 图形所需要的数据对象
IAxisDataSeries dataSeries = new DataSeries(xAxisLabels,
xAxisTitle, yAxisTitle, title);
// 设置条形数据
double[][] data = new double[][] { { 1500, 6880, 4510, 2600, 0,
1580, 0, 9555, 11000, 0, 7500, 5880, 3510, 2600,
1200, 1580, 9000, 8555, 9000, 3120 } };
// 条形区域 形示的标签
String[] legendLabels = { "8" };
// String[] legendLabels = null;
// 条形区域绘制的颜色设置对象
Paint[] paints = new Paint[] { new Color(18, 189, 255) };
dataSeries.addIAxisPlotDataSet(new AxisChartDataSet(data,
legendLabels, paints, ChartType.BAR,
this.barChartProperties));
// 产生一个 chart对象
AxisChart axisChart = new AxisChart(dataSeries,
this.chartProperties, this.axisProperties,
this.legendProperties, this.width, this.height);
// 输出设置好的chart图形
ServletEncoderHelper.encodeJPEG13(axisChart, 1.0f,
httpServletResponse);
} catch (Throwable throwable) {
// HACK do your error handling here...
throwable.printStackTrace();
}
}
}
在上下优美的效果,很多可以继续优化


 1604
1604


 被折叠的 条评论
为什么被折叠?
被折叠的 条评论
为什么被折叠?
 到【灌水乐园】发言


