


2007年秋,开始接触数值计算,看到Contour图形,我觉得很神奇,很好看。一个师兄会,可是没教我,强烈的好奇心驱使下,零零碎碎看了相关文献,都看不懂。大约2009年深秋,我读到的最早且能看懂的关于Contour绘制的文章,也是我写Contour的最主要参考:
Contour Plotter and 3D Function Grapher Together - the Applet and the Source Code
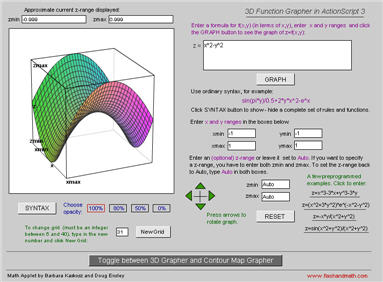
We present here another example how our custom ActionScript 3 classes in the package flashandmath.as3.* can be used to build advanced graphers and math applets. We show an applet which combines a contour diagram plotter and a 3D grapher. The user can input function formulas and variables ranges. The applet uses our custom classes: MathParser, GraphingBoard, GraphingBoard3D, and many helper classes. Click either of the images below to open the applet in a separate window.
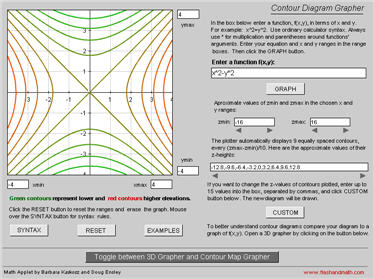
The image above shows the contour map part, the one below the 3D grapher part.
上图关键代码如下:
/* ***********************************************************************
This template and the classes in the package
flashandmath.as3.* were created by

Barbara Kaskosz of the University of Rhode Island
(bkaskosz@math.uri.edu) and
Douglas E. Ensley of Shippensburg University
(DEnsley@ship.edu).

Feel free to use and modify the classes in the package
flashandmath.as3.* to create
your own Flash applications for educational purposes under the
following two conditions:

1) Please include a line acknowledging this work and the authors
with your application in a way that is visible in your compiled file
or on your html page.

2) If you choose to modify the classes in the package
flashandmath.as3.*, put them into a package different from
the original. In this case too, please acknowledge this work
in a way visible to the user.

If you wish to use the materials for commercial purposes, you need our
permission.

This work is supported in part by the National Science Foundation
under the grant DUE-0535327.

Last modified: October, 2008
************************************************************************ */

/*
The packages imported below contain MathParser, CompiledObject,
GraphingBoard3D, and MatrixUtils -- the custom classes needed
in this script. For Flash to find it, you should put the folder flashandmath
(with all the nested subfolders) in the same directory as this fla file.
The necessary classes will be compiled into your swf file. See
the accompanying pdf guide for full documentation of the classes.
*/

import flashandmath.as3.parsers.*;
import flashandmath.as3.boards.*;
import flashandmath.as3.utilities.*;

stage.scaleMode="noScale";

/*
We create an instance of MathParser. Variables allowed in the
user's input are t and s. The constructor of MathParser
takes an array of strings as a parameter. The strings represent
the names of variables that you want in your application. We are
storing our instance of MathParser in a variable called "procFun".
*/

var procFun:MathParser=new MathParser(["t","s"]);

/*
We are instantiating RangeParser. We need it mostly to allow input
in the t and s range boxes involving multiplies of pi, e.g., "3/2*pi".
*/

var procRange:RangeParser=new RangeParser();

/*
Below we are creating an instance of GraphingBoard3D and store it in the
variable "board". The instance will be responsible for creating and
manipulating your 3d graphs. The instance will create
and control error display text field and coordinate display fields.
The constructor takes one parameter: the size, in pixels, of the
square graphing board that will hold all the graphs. The sizes and the appearance
of all the elements are customizable through methods of GraphingBoard.
In this tepmplete, we use default values so we do not evoke those methods.
See fun_graph3d_as3_mod.fla to see the methods in action.
*/

var board:GraphingBoard3D=new GraphingBoard3D(330);

/*
GraphingBoard extends Sprite so it inherits from Sprite. We add
"board" to the Display List and position it using methods of Sprite.
The position coordinates determine the location of the upper
left corner of the graphing board.
*/

this.addChild(board);

board.x=15;

board.y=55;

/*
The next six variables store the x, y, and z ranges.
maxLen stores the longest range to be used with the
scaling constrained option.
*/

var xmin:Number;
var xmax:Number;
var ymin:Number;
var ymax:Number;
var zmin:Number;
var zmax:Number;

var maxLen:Number;

//The rotation matrix for the initial view.

var iniMatrix:Array=[];

//The size of the cube in which each surface will reside.

var size:Number;

/*
We want the vertical axis (it is the y axis for us and
the z axis for the user) to remain vertical. So we will
rotate it together with a sufrace and store the new direction
in "newy" variable.
*/
var newy:Array=[0,1,0];

//The next variable keeps track of the user's error presence.

var bIsError:Boolean=false;

//Scaling constrained yes or no variable.

var bIsConstr:Boolean=true;

/*
In this template, the ten examples in the gallery are hard-wired
into the fla file. "galleryCount" keeps track which example
should be loaded.
*/

var galleryCount:int=1;

var numExamples:int=10;

/*
The Boolean variable, doRotate, changes to "true" if the user
presses the mouse over a surface to rotate it.
The variables prevX, prevY keep track of the previous position
of the mouse during rotation.
*/

var doRotate:Boolean=false;

var prevX:Number;

var prevY:Number;

/*
The user can choose the grid by entering an integer into meshBox.
We restrict characters that can be entered into the box.
*/
meshBox.restrict="0123456789";

size=board.getCubeSize();

//We set the initial grid to 30.

meshBox.text="30";

board.nMesh=30;

//We enable the display of x, y, and z range boxes that show the current ranges.

board.enableRangeBoxes();

//We set the initial input for the t and s ranges and parametric equations.

tminInputBox.text="0";
tmaxInputBox.text="3";
sminInputBox.text="0";
smaxInputBox.text="2*pi";


coord1InputBox.text="cos(s)";

coord2InputBox.text="sin(s)";

coord3InputBox.text="t";

//We set some properties of input boxes that make them look and behave better.

coord1InputBox.wordWrap=true;
coord2InputBox.wordWrap=true;
coord3InputBox.wordWrap=true;

coord1InputBox.borderColor=0xCC0000;
coord2InputBox.borderColor=0xCC0000;
coord3InputBox.borderColor=0xCC0000;


tminInputBox.wordWrap=true;
tmaxInputBox.wordWrap=true;
sminInputBox.wordWrap=true;
smaxInputBox.wordWrap=true;


meshBox.wordWrap=true;

/*
The movie clip "Instructions" has been created on the Stage and stored
in the Library with the linkage to AS3. Now we can create an instance
of the clip and add it to the Display List.
*/

var mcSyntax:Instructions=new Instructions();

this.addChild(mcSyntax);

mcSyntax.visible=false;

mcSyntax.x=350;

mcSyntax.y=5;

//The four movie clips which outline in red the opacity setting selected by the user.

mcOutline1.gotoAndStop(2);
mcOutline2.gotoAndStop(1);
mcOutline3.gotoAndStop(1);
mcOutline4.gotoAndStop(1);

//Scaling constrained is initially set to true.

constrBox.text="On";

function iniRotationMatrix():Array {

	var Ver:Array=[];

	var iniMat:Array=[];

    Ver=MatrixUtils.MatrixByVector(MatrixUtils.rotMatrix(1,0,0,-15.2*Math.sqrt(2)),[0,1,0]);

    iniMat=MatrixUtils.MatrixByMatrix(MatrixUtils.rotMatrix(Ver[0],Ver[1],Ver[2],15*Math.PI/2),MatrixUtils.rotMatrix(1,0,0,-15.2*Math.sqrt(2)));

	return iniMat;

}

//We are calculating the rotation matrix of the initial view.

iniMatrix=iniRotationMatrix();

/*
We are calling our procInput function which displays the surface
based on the data in the input boxes. prepGraph function compiles
the user's input. If a syntax error is found, procInput quits.
Otherwise, prepGraph  passes the compiled data to "board".
drawGraph calls a drawing method of GraphingBoard that
renders the surface.
*/

procInput();

function procInput():void {

      prepGraph();

	  if(bIsError){return;}

      drawGraph(iniMatrix);

}

//A couple of helper functions.

function notLegalValue(a:*):Boolean {

	if((typeof a)!="number" || isNaN(a) || !isFinite(a)){

			return true;} else {return false;}


}

function isLegal(a:*):Boolean {

	if(!notLegalValue(a)){return true;}

	else {return false;}


}

/*
prepGraph function parses the user's input, calculates pixel positions
of nodes to be plotted, displays errors, and calculates the minimum
and maximum values for x, y, and z. Error messages are displayed
by evoking board.showError instance method.
If no error is found, the array of nodes to be plotted
is passed to "board".
*/


function prepGraph():void {

	var i:Number;
	var j:Number;
	var curx:Number;
	var cury:Number;
	var curz:Number;

	var curt:Number;
	var curs:Number;

	var tmin:Number;
    var tmax:Number;
    var smin:Number;
    var smax:Number;

	/*
	MathParser's doCompiled method returns a custom datatype, CompiledObject.
	Each instance of CompiledObject has three properties: PolishArray that
	represents a mathematical formula in the form suitable for evaluation,
	errorStatus (1 or 0), and errorMes containing a specific syntax error message
	to the user. We will be compiling the user entries for x(t,s), y(t,s), and
	z(t,s), so we create three variables to store the results.
	*/

	var compObj1:CompiledObject;
	var compObj2:CompiledObject;
	var compObj3:CompiledObject;

	/*
	RangeParser returns a custom datatype RangeObject with three properties:
	Values, errorStatus, errorMes.
	*/

	var oRange:RangeObject;

	//We are reading the user's input for x, y, and z.

	var inpString1:String=coord1InputBox.text;
	var inpString2:String=coord2InputBox.text;
	var inpString3:String=coord3InputBox.text;

	//Three convenient arrays to determine the x, y, and z ranges.

	var yArray:Array=[];
	var xArray:Array=[];
	var zArray:Array=[];

	//Two arrays to store functional and pixel values of nodes.

	var fArray:Array=[];

	var pArray:Array=[];

    var mesh:Number=board.nMesh;

	//Resetting the graphing board and range display boxes.

	bIsError=false;

	newy=[0,1,0];

	board.resetBoard();

	board.yRangeBox.text="";

	board.xRangeBox.text="";

	board.zRangeBox.text="";

	/*
	Parsing the user's input for the t and s ranges. If a mistake is found,
	the function quits. Otherwise the ranges are set. The ranges are retrieved from
	the Values property of the RangeObject, oRange.
	*/

	oRange=procRange.parseRangeFour(tminInputBox.text,tmaxInputBox.text,sminInputBox.text,smaxInputBox.text);

    if(oRange.errorStatus==1){

		board.showError("Error. "+oRange.errorMes);

		bIsError=true;

		return;

	}

	tmin=oRange.Values[0];

	tmax=oRange.Values[1];

	smin=oRange.Values[2];

	smax=oRange.Values[3];

	/*
	Parsing the user's input for x, y, and z. We use the doCompile method of MathParser.
	If a mistake is found, the function quits.
	*/

	if(inpString1.length>0 && inpString2.length>0 && inpString3.length>0){

	compObj1=procFun.doCompile(inpString1);

	if(compObj1.errorStatus==1){

		board.showError("Error in the first coordinate. "+compObj1.errorMes);

		bIsError=true;

		return;

	}

	compObj2=procFun.doCompile(inpString2);

	if(compObj2.errorStatus==1){

		board.showError("Error in the second coordinate. "+compObj2.errorMes);

		bIsError=true;

		return;

	}

	compObj3=procFun.doCompile(inpString3);

	if(compObj3.errorStatus==1){

		board.showError("Error in the third coordinate. "+compObj3.errorMes);

		bIsError=true;

		return;

	}

	/*
	If no mistake was found, we use doEval method of MathParser to calculate
	the functional coordinates of the nodes. Here, we need to remember that the user's
	x, y, and z coordinates are z, x, and y coordinates for us, respectively.
	It is easier to relate them to Flash's coordinate system that way.
	The functional coordinates of the nodes are stored in fArray.
	We also populate xArray, yArray, and zArray to eventually calculate
	the x, y, and z ranges.
	*/

	for(j=0; j<=mesh;j++){

		fArray[j]=[];

		curt=tmin+j*(tmax-tmin)/mesh;

    for(i=0; i<=mesh; i++){

		curs=smin+i*(smax-smin)/mesh;

		cury=procFun.doEval(compObj3.PolishArray,[curt,curs]);
		curz=procFun.doEval(compObj1.PolishArray,[curt,curs]);
		curx=procFun.doEval(compObj2.PolishArray,[curt,curs]);

		fArray[j][i]=[curx,cury,curz];

		if(isLegal(cury)){yArray.push(cury);}
		if(isLegal(curx)){xArray.push(curx);}
		if(isLegal(curz)){zArray.push(curz);}


  }

	}


	  if(yArray.length==0){ymin=-1; ymax=1;} else {

	   yArray.sort(Array.NUMERIC);

	   ymin=yArray[0];

	   ymax=yArray[yArray.length-1];

	  }


	   if(ymax==ymin){ymax+=0.5; ymin+=-0.5;}


	    if(xArray.length==0){xmin=-1; xmax=1;} else {

	   xArray.sort(Array.NUMERIC);

	   xmin=xArray[0];

	   xmax=xArray[xArray.length-1];

	  }


	   if(xmax==xmin){xmax+=0.5; xmin+=-0.5;}

	    if(zArray.length==0){zmin=-1; zmax=1;} else {

	   zArray.sort(Array.NUMERIC);

	   zmin=zArray[0];

	   zmax=zArray[zArray.length-1];

	  }


	   if(zmax==zmin){zmax+=0.5; zmin+=-0.5;}

	   if(bIsConstr){

		   maxLen=Math.max((xmax-xmin),Math.max(ymax-ymin,zmax-zmin));

		   board.yRangeBox.text="ymin="+String(Math.round(((xmax+xmin)/2-maxLen/2)*100)/100)+"\n"+"ymax="+String(Math.round(((xmax+xmin)/2+maxLen/2)*100)/100);

	       board.xRangeBox.text="xmin="+String(Math.round(((zmax+zmin)/2-maxLen/2)*100)/100)+"\n"+"xmax="+String(Math.round(((zmax+zmin)/2+maxLen/2)*100)/100);

		   board.zRangeBox.text="zmin="+String(Math.round(((ymax+ymin)/2-maxLen/2)*100)/100)+"\n"+"zmax="+String(Math.round(((ymax+ymin)/2+maxLen/2)*100)/100);

	   } else {


	    board.yRangeBox.text="ymin="+String(Math.round(xmin*100)/100)+"\n"+"ymax="+String(Math.round(xmax*100)/100);

	    board.xRangeBox.text="xmin="+String(Math.round(zmin*100)/100)+"\n"+"xmax="+String(Math.round(zmax*100)/100);

		board.zRangeBox.text="zmin="+String(Math.round(ymin*100)/100)+"\n"+"zmax="+String(Math.round(ymax*100)/100);


	   }

	   /*
	   We calculated and displayed x, y, and z ranges. We calculated functional
	   coordinates of the nodes. Now we are going to compute the pixel coordinates
	   of the nodes and store them in pArray. We will also check
	   which vertices have coordinates which are all legal numbers.
	   This information -- 0 for yes, 1 for no -- will also be stored in
	   pArray as the fourth coordinate of each node.
	   The pArray will be then passed to "board".
	   */


	   for(j=0; j<=mesh;j++){

		   pArray[j]=[];

		  for(i=0; i<=mesh;i++){

			  pArray[j][i]=[];

			  pArray[j][i][0]=xtoPix(fArray[j][i][0]);

			  pArray[j][i][1]=ytoPix(fArray[j][i][1]);

		      pArray[j][i][2]=ztoPix(fArray[j][i][2]);

	if(isLegal(fArray[j][i][0]) && isLegal(fArray[j][i][1]) && isLegal(fArray[j][i][2])){

		pArray[j][i][3]=0;

	} else { pArray[j][i][3]=1;}


		  }

	   }

	   fArray=[];

	}

	board.setPixArray(pArray);

}

/*
drawGraph function uses methods of GraphingBoard to draw a surface and the axes
corresponding to a rotation matrix M. The function will work if "board"
knows already the nodes; that is, after prepGraph has run.
*/

function drawGraph(M:Array):void {

	board.drawSurface(M);

	board.drawAxes(M);

    newy=MatrixUtils.MatrixByVector(M,newy);


}

//Conversion functions from functional to pixel values.

function xtoPix(xfun:Number):Number {

	var xconv:Number;

	var localsize:Number;

	if(bIsConstr){

		localsize=size*(xmax-xmin)/maxLen;

	} else {localsize=size;}

	xconv=2*localsize/(xmax-xmin);

	return localsize-(xmax-xfun)*xconv;

                     }


function ytoPix(yfun:Number):Number {

	var yconv:Number;

	var localsize:Number;

	if(bIsConstr){

		localsize=size*(ymax-ymin)/maxLen;

	} else {localsize=size;}

	yconv=2*localsize/(ymax-ymin);

	return localsize-(yfun-ymin)*yconv;

                     }


function ztoPix(zfun:Number):Number {

	var zconv:Number;

	var localsize:Number;

	if(bIsConstr){

		localsize=size*(zmax-zmin)/maxLen;

	} else {localsize=size;}

	zconv=2*localsize/(zmax-zmin);

	return localsize-(zmax-zfun)*zconv;

                     }

/*
GRAPH button displays "Processing..." message when pressed.
It evokes procInput when relased. When released outside,
it does nothing. Opacity buttons and the grid button
work similarly.
*/

butGraph.addEventListener(MouseEvent.MOUSE_DOWN,graphDown);

butGraph.addEventListener(MouseEvent.MOUSE_UP,graphUp);


	function graphDown(e:MouseEvent): void {

         board.setWaitBoxVisible(true);

		 stage.addEventListener(MouseEvent.MOUSE_UP,upOutside);


	}

	function upOutside(e:MouseEvent): void {

		board.setWaitBoxVisible(false);

		stage.removeEventListener(MouseEvent.MOUSE_UP,upOutside);


	}

	function graphUp(e:MouseEvent): void {

        procInput();

	}


//The opacity buttons change the opacity of a surface and move the red outline.

butPerc1.addEventListener(MouseEvent.MOUSE_DOWN,perc1Down);

butPerc1.addEventListener(MouseEvent.MOUSE_UP,perc1Up);


	function perc1Down(e:MouseEvent): void {

         board.setWaitBoxVisible(true);

		 stage.addEventListener(MouseEvent.MOUSE_UP,upOutside);


	}


	function perc1Up(e:MouseEvent): void {

    board.nOpacity=1.0;
	drawGraph(MatrixUtils.rotMatrix(0,0,0,0));
	board.setWaitBoxVisible(false);
	mcOutline1.gotoAndStop(2);
	mcOutline2.gotoAndStop(1);
	mcOutline3.gotoAndStop(1);
	mcOutline4.gotoAndStop(1);

	}


butPerc2.addEventListener(MouseEvent.MOUSE_DOWN,perc2Down);

butPerc2.addEventListener(MouseEvent.MOUSE_UP,perc2Up);


	function perc2Down(e:MouseEvent): void {

         board.setWaitBoxVisible(true);

		stage.addEventListener(MouseEvent.MOUSE_UP,upOutside);


	}


	function perc2Up(e:MouseEvent): void {

	board.nOpacity=0.8;
	drawGraph(MatrixUtils.rotMatrix(0,0,0,0));
	board.setWaitBoxVisible(false);
	mcOutline1.gotoAndStop(1);
	mcOutline2.gotoAndStop(2);
	mcOutline3.gotoAndStop(1);
	mcOutline4.gotoAndStop(1);


	}


butPerc3.addEventListener(MouseEvent.MOUSE_DOWN,perc3Down);

butPerc3.addEventListener(MouseEvent.MOUSE_UP,perc3Up);


	function perc3Down(e:MouseEvent): void {

         board.setWaitBoxVisible(true);

		stage.addEventListener(MouseEvent.MOUSE_UP,upOutside);


	}


	function perc3Up(e:MouseEvent): void {

	board.nOpacity=0.5;
	drawGraph(MatrixUtils.rotMatrix(0,0,0,0));
	board.setWaitBoxVisible(false);
	mcOutline1.gotoAndStop(1);
	mcOutline2.gotoAndStop(1);
	mcOutline3.gotoAndStop(2);
	mcOutline4.gotoAndStop(1);


	}


butPerc4.addEventListener(MouseEvent.MOUSE_DOWN,perc4Down);

butPerc4.addEventListener(MouseEvent.MOUSE_UP,perc4Up);


	function perc4Down(e:MouseEvent): void {

         board.setWaitBoxVisible(true);

		stage.addEventListener(MouseEvent.MOUSE_UP,upOutside);


	}


	function perc4Up(e:MouseEvent): void {

	board.nOpacity=0.0;
	drawGraph(MatrixUtils.rotMatrix(0,0,0,0));
	board.setWaitBoxVisible(false);
	mcOutline1.gotoAndStop(1);
	mcOutline2.gotoAndStop(1);
	mcOutline3.gotoAndStop(1);
	mcOutline4.gotoAndStop(2);


	}


butConstr.addEventListener(MouseEvent.CLICK,setConstr);

function setConstr(e:MouseEvent):void {

	bIsConstr=!bIsConstr;

	if(bIsConstr){

		constrBox.text="On";


	} else {

		constrBox.text="Off";
	}


}

/*
GALLERY button loads examples of surfaces that are defined below.
In the Cylindrical Coordinates template, examples are loaded
at runtime from an external XML file.
*/

butGallery.addEventListener(MouseEvent.MOUSE_DOWN,galleryDown);

butGallery.addEventListener(MouseEvent.MOUSE_UP,galleryUp);

function galleryDown(e:MouseEvent): void {

         board.setWaitBoxVisible(true);

		 stage.addEventListener(MouseEvent.MOUSE_UP,upOutside);


	}

function galleryUp(e:MouseEvent):void {

	galleryCount+=1;

	if(galleryCount>numExamples){

		galleryCount=1;
	}

	this["loadExample"+galleryCount]();

}


function loadExample1():void {

	tminInputBox.text="0";
    tmaxInputBox.text="3";

	sminInputBox.text="0";
    smaxInputBox.text="2*pi";

	coord1InputBox.text="cos(s)";

	coord2InputBox.text="sin(s)";

	coord3InputBox.text="t";

	bIsConstr=true;

	constrBox.text="On";

	procInput();

}

function loadExample2():void {

	tminInputBox.text="-1";
    tmaxInputBox.text="1";

	sminInputBox.text="0";
    smaxInputBox.text="2*pi";

	coord1InputBox.text="t*cos(s)";

	coord2InputBox.text="t*sin(s)";

	coord3InputBox.text="t";

	bIsConstr=true;

	constrBox.text="On";

	procInput();

}

function loadExample3():void {

	tminInputBox.text="0";
    tmaxInputBox.text="pi";

	sminInputBox.text="0";
    smaxInputBox.text="2*pi";

	coord1InputBox.text="sin(t)*cos(s)";

	coord2InputBox.text="sin(t)*sin(s)";

	coord3InputBox.text="cos(t)";

	bIsConstr=true;

	constrBox.text="On";

	procInput();


}

function loadExample4():void {

	tminInputBox.text="-0.5";
    tmaxInputBox.text="0.5";

	sminInputBox.text="0";
    smaxInputBox.text="2*pi";

	coord1InputBox.text="2*cos(s)+t*cos(s/2)";

	coord2InputBox.text="2*sin(s)+t*cos(s/2)";

	coord3InputBox.text="4*t*sin(s/2)";

	bIsConstr=true;

	constrBox.text="On";

	procInput();


}

function loadExample5():void {

	tminInputBox.text="0";
    tmaxInputBox.text="2*pi";

	sminInputBox.text="0";
    smaxInputBox.text="2*pi";

	coord1InputBox.text="3*cos(s)+cos(t)*cos(s)";

	coord2InputBox.text="3*sin(s)+cos(t)*sin(s)";

	coord3InputBox.text="sin(t)";

	bIsConstr=true;

	constrBox.text="On";

	procInput();


}

function loadExample6():void {

	tminInputBox.text="0";
    tmaxInputBox.text="2*pi";

	sminInputBox.text="0";
    smaxInputBox.text="1";

	coord1InputBox.text="(1-s)*(3+cos(t))*cos(2*pi*s)";

	coord2InputBox.text="(1-s)*(3+cos(t))*sin(2*pi*s)";

	coord3InputBox.text="6*s+(1-s)*sin(t)";

	bIsConstr=false;

	constrBox.text="Off";

	procInput();


}

function loadExample7():void {

	tminInputBox.text="-1";
    tmaxInputBox.text="1";

	sminInputBox.text="-1";
    smaxInputBox.text="1";

	coord1InputBox.text="s";

	coord2InputBox.text="0";

	coord3InputBox.text="t";

	bIsConstr=true;

	constrBox.text="On";

	procInput();


}

function loadExample8():void {

	tminInputBox.text="0";
    tmaxInputBox.text="pi";

	sminInputBox.text="-5";
    smaxInputBox.text="2*pi";

	coord1InputBox.text="(4/3)^s*sin(t)*sin(t)*cos(s)";

	coord2InputBox.text="(4/3)^s*sin(t)*sin(t)*sin(s)";

	coord3InputBox.text="(4/3)^s*sin(t)*cos(t)";

	bIsConstr=true;

	constrBox.text="On";

	procInput();


}

function loadExample9():void {

	tminInputBox.text="0";
    tmaxInputBox.text="pi";

	sminInputBox.text="0";
    smaxInputBox.text="2*pi";

	coord1InputBox.text="(1+0.5*sin(3*t))*sin(t)*sin(s)";

	coord2InputBox.text="(1+0.5*sin(3*t))*sin(t)*cos(s)";

	coord3InputBox.text="(1+0.5*sin(2*t))*sin(t)";

	bIsConstr=false;

	constrBox.text="Off";

	procInput();


}

function loadExample10():void {

	tminInputBox.text="0";
    tmaxInputBox.text="sqrt(pi)";

	sminInputBox.text="0";
    smaxInputBox.text="2*pi";

	coord1InputBox.text="sin(t)*cos(s)";

	coord2InputBox.text="sin(t)*sin(s)";

	coord3InputBox.text="cos(2*t^2)";

	bIsConstr=true;

	constrBox.text="On";

	procInput();


}

/*
When the user mouses over SYNTAX button,Instructions clip (stored in mcSyntax
variable) is displayed or hidden. The actions of the New Grid button and RESET button
are self-explanatory. The buttons have instance names
butGrid and butReset, respectvely. AS3 addresses them by those names.
*/

butSyntax.addEventListener(MouseEvent.ROLL_OVER,showSyntax);

function showSyntax(e:MouseEvent):void {

	mcSyntax.visible=true;

}

butSyntax.addEventListener(MouseEvent.ROLL_OUT,hideSyntax);

function hideSyntax(e:MouseEvent):void {

	mcSyntax.visible=false;

}


butGrid.addEventListener(MouseEvent.MOUSE_DOWN,gridDown);

butGrid.addEventListener(MouseEvent.MOUSE_UP,gridUp);


	function gridDown(e:MouseEvent): void {

         board.setWaitBoxVisible(true);

		stage.addEventListener(MouseEvent.MOUSE_UP,upOutside);


	}


	function gridUp(e:MouseEvent): void {

	   changeGrid();

	}


function changeGrid():void {

	var entMesh:String=meshBox.text;

	var numMesh:Number=30;

	if(entMesh==""){

		board.nMesh=30;

		meshBox.text="30";

		procInput();

		return;


	}

	numMesh=Number(meshBox.text);

	if(notLegalValue(numMesh)){

		board.nMesh=30;

		meshBox.text="30";

		procInput();

		return;

	}

	numMesh=Math.round(numMesh);

	if(numMesh<5){

		board.nMesh=5;

		meshBox.text="5";

		procInput();

	}

	else if(numMesh>40){

		board.nMesh=40;

		meshBox.text="40";

		procInput();


	} else {

	board.nMesh=numMesh;

	meshBox.text=String(numMesh);

	procInput();

	}

}

butReset.addEventListener(MouseEvent.CLICK,resetClick);

function resetClick(e:MouseEvent):void {

	bIsError=false;

	newy=[0,1,0];

	board.resetBoard();

	coord1InputBox.text="";
	coord2InputBox.text="";
	coord3InputBox.text="";

	tminInputBox.text="-1";
    tmaxInputBox.text="1";

    sminInputBox.text="-1";
    smaxInputBox.text="1";

	board.yRangeBox.text="ymin="+String(-1)+"\n"+"ymax="+String(1);

	board.xRangeBox.text="xmin="+String(-1)+"\n"+"xmax="+String(1);

	board.zRangeBox.text="zmin="+String(-1)+"\n"+"zmax="+String(1);

	meshBox.text="30";

	board.nOpacity=1;

    mcOutline1.gotoAndStop(2);
    mcOutline2.gotoAndStop(1);
    mcOutline3.gotoAndStop(1);
    mcOutline4.gotoAndStop(1);

	changeGrid();

	board.setWaitBoxVisible(false);

	bIsConstr=false;

	constrBox.text="Off";

}

/*
We attach listeners to "board" which will cause the surface to
rotate as the user presses the mouse button over it
and moves the mouse.
*/

		board.addEventListener(MouseEvent.ROLL_OUT,boardOut);

		board.addEventListener(MouseEvent.MOUSE_MOVE,boardMove);

		board.addEventListener(MouseEvent.MOUSE_DOWN,boardDown);

		board.addEventListener(MouseEvent.MOUSE_UP,boardUp);


	function boardOut(e:MouseEvent):void {

			doRotate=false;

	}

	 function boardDown(e:MouseEvent):void {

			prevX=board.mouseX;

			prevY=board.mouseY;

			doRotate=true;

	}

	function boardUp(e:MouseEvent):void {

			doRotate=false;

	}

	 function boardMove(e:MouseEvent):void {

		        var locX:Number=prevX;

				var locY:Number=prevY;

				if(doRotate){

				prevX=board.mouseX;

				prevY=board.mouseY;

				drawGraph(MatrixUtils.rotMatrix(1,0,0,3*(locY-prevY)));

				drawGraph(MatrixUtils.rotMatrix(newy[0],newy[1],newy[2],3*(prevX-locX)));

				e.updateAfterEvent();

				}
	}
Download
Download all 'fla' and 'as' files for this tutorial in the following compressed folder. The folder also contains pdf guides describing methods properties of the custom AS3 classes in the flashandmath.as3.* package..
The source code for the applet is well-commented and should be easy to read and modify.
You will find many more examples as well as extensive discussion of the classes in our book:Flash and Math Applets: Learn by Example.
话说这些技术貌似已经过时了,其实也很有必要去看,这样你会理解它的工作原理:包括三角单元剖分,染色、Z排序,3D图形在2D平面显示的算法等。


 962
962


 被折叠的 条评论
为什么被折叠?
被折叠的 条评论
为什么被折叠?
 到【灌水乐园】发言


