


1 绘制流程图
\documentclass[a4paper,UTF8]{article}
\usepackage{xcolor}
\usepackage{tikz}

\usetikzlibrary{arrows,shapes,chains}


\begin{document}


	\centering
	\begin{figure}
		\scriptsize
		\tikzstyle{format}=[rectangle,draw,thin,fill=white]
		\tikzstyle{test}=[diamond,aspect=2,draw,thin]
		\tikzstyle{point}=[coordinate,on grid,]
		\begin{tikzpicture}[node distance=8mm,
				auto,>=latex',
				thin,
				start chain=going below,
				every join/.style={norm},]
			\node[format] (n0){A};
			\node[format,below of=n0] (n1){B};
			\node[format,below of=n1] (n2){C};
			\node[format,below of=n2] (n3){D};
			\node[point,right of=n3] (p0){};
			\node[point,left of=n3] (p1){};
			\node[format,below of=n3] (n4){E};
			\node[format,below of=n4] (n5){F};
			\node[format,right of=n5] (n6){G};
			\node[test,below of=n5] (n7){H};
			\node[point,right of=n7] (p2){};
			\node[format,below of=n7] (n8){I};

			\draw[->] (n0.south) -- (n1);
			\draw[->] (n1.south) -- (n2);
			\draw[->] (n2.south) -- (n3);
			\draw[->] (n3.south) -- (n4);
			\draw[->] (n4.south) -- (n5);
			\draw[->] (n5.south) -- (n7);
			\draw[->] (n7.south) to node {Yes} (n8);

			\draw[->] (n7.east) to node {No} (p2) |- (n6.south);
			\draw[->] (n6.north) -- (p0) |- (n3.east);
		\end{tikzpicture}
	\end{figure}
\end{document}
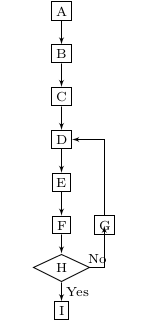
\tikzstyle{test}=[diamond,aspect=2,draw,thin,text width=2cm]start chain=going below指明了流程图的默认方向,node ditance=8mm则指明了默认的node距离。这些可以在定义node的时候更改,比如说
\node[point,right of=n3,node distance=10mm] (p0){}; 定义完node之后画线。线可以是实线、虚线、曲线等,也可以带箭头和不带箭头。
箭头
	\begin{figure}
		\scriptsize
		\tikzstyle{format}=[rectangle,draw,thin,fill=white]
		\tikzstyle{test}=[diamond,aspect=2,draw,thin,text width=2cm]
		\tikzstyle{point}=[coordinate,on grid,]
		\begin{tikzpicture}[node distance=8mm,
				auto,>=latex',
				thin,
				start chain=going below,
				every join/.style={norm},]
			\node[format] (n0){A};
			\node[format,below of=n0] (n1){B};
			\draw[->] (n0.south) -- (n1);
		\end{tikzpicture}
	\end{figure}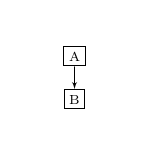
不带箭头
\begin{figure}
		\scriptsize
		\tikzstyle{format}=[rectangle,draw,thin,fill=white]
		\tikzstyle{test}=[diamond,aspect=2,draw,thin,text width=2cm]
		\tikzstyle{point}=[coordinate,on grid,]
		\begin{tikzpicture}[node distance=8mm,
				auto,>=latex',
				thin,
				start chain=going below,
				every join/.style={norm},]
			\node[format] (n0){A};
			\node[format,below of=n0] (n1){B};
			\draw[-] (n0.south) -- (n1);
		\end{tikzpicture}
	\end{figure}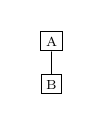
双箭头和虚线
\begin{figure}
		\scriptsize
		\tikzstyle{format}=[rectangle,draw,thin,fill=white]
		\tikzstyle{test}=[diamond,aspect=2,draw,thin,text width=2cm]
		\tikzstyle{point}=[coordinate,on grid,]
		\begin{tikzpicture}[node distance=18mm,
				auto,>=latex',
				thin,
				start chain=going below,
				every join/.style={norm},]
			\node[format] (n0){A};
			\node[format,below of=n0] (n1){B};
			\node[format,below of=n1](n2){C};
			\draw[<->] (n0.south) -- (n1.north);
			\draw[<-,dashed] (n1.south) -- (n2.north);
		\end{tikzpicture}
	\end{figure}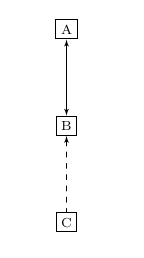
带文字的线
\begin{figure}
		\scriptsize
		\tikzstyle{format}=[rectangle,draw,thin,fill=white]
		\tikzstyle{test}=[diamond,aspect=2,draw,thin,text width=2cm]
		\tikzstyle{point}=[coordinate,on grid,]
		\begin{tikzpicture}[node distance=18mm,
				auto,>=latex',
				thin,
				start chain=going below,
				every join/.style={norm},]
			\node[format] (n0){A};
			\node[format,below of=n0] (n1){B};
			\node[format,below of=n1](n2){C};
			\draw[<-] (n0.south) to node{Yes} (n1.north);
			\draw[<-,dashed] (n1.south) -- (n2.north);
		\end{tikzpicture}
	\end{figure}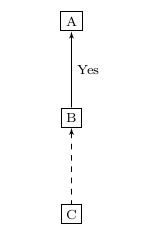
文字总是在箭头方向的右边,如果想让文字在左边可以这样做,
\draw[->] (n1.north) to node{Yes} (n0.south);曲线和带颜色的线
\begin{figure}
		\scriptsize
		\tikzstyle{format}=[rectangle,draw,thin,fill=white]
		\tikzstyle{test}=[diamond,aspect=2,draw,thin,text width=2cm]
		\tikzstyle{point}=[coordinate,on grid,]
		\begin{tikzpicture}[node distance=18mm,
				auto,>=latex',
				thin,
				start chain=going below,
				every join/.style={norm},]
			\node[format] (n0){A};
			\node[format,below of=n0] (n1){B};
			\node[format,below of=n1](n2){C};
			\draw[->] (n1.north) to[out=60,in=300] node{Yes} (n0.south);
			\draw[->,draw=red](n2)--(n1);
		\end{tikzpicture}
	\end{figure}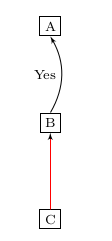
\node[format] (n0) at(3,0){A};2 画故障树
\usetikzlibrary{arrows,shapes,chains,shapes.gates.logic.US,trees,positioning}\begin{figure}
\begin{tikzpicture}[
and/.style={and gate US,thick,draw,fill=red!60,rotate=90,
anchor=east,xshift=-1mm,scale=0.7},
or/.style={or gate US,thick,draw,fill=blue!60,rotate=90,
anchor=east,xshift=-1mm,scale=0.7},
label distance=1mm,
every label/.style={blue},
event/.style={rectangle,thick,draw,fill=yellow!20,text width=0.5cm,
text centered,font=\sffamily,anchor=north},
basicEvent/.style={circle,thick,draw,fill=blue!20,text width=0.5cm,
text centered,font=\sffamily,anchor=north},
edge from parent/.style={very thick,draw=black!70},
edge from parent path={(\tikzparentnode.south) -- ++(0,-0.8cm)
-| (\tikzchildnode.north)},
level 1/.style={sibling distance=7cm,level distance=0.9cm,
growth parent anchor=south,nodes=event},
level 2/.style={sibling distance=3cm},
level 3/.style={sibling distance=2cm},
level 4/.style={sibling distance=1cm}
]
\node (g1) [event] {A}
child{node (g2) {B}
child {node (g3) {C}
child {node (g4) {D}
child {node (t1)[basicEvent] {e0}}
child {node (b2)[basicEvent] {e1}}
}
child {node (g5) {G}
child {node (t2)[basicEvent] {e1}}
child {node (b3)[basicEvent] {e2}}
}
}
child {node (b1)[basicEvent] {e3}}
};
\node [and] at (g1.south) {};
\node [or] at (g2.south) {};
\node [and] at (g3.south) {};
\node [or] at (g4.south) {};
\node [or] at (g5.south) {};
\end{tikzpicture}
\end{figure}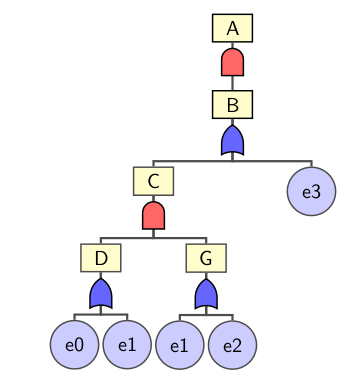
node .. child使用使用树的形式定义故障树,sibling distance=1cm声明了两个兄弟节点的距离,scale=0.7缩放逻辑门。
3 结合beamer
\begin{figure}
		\begin{minipage}[t]{0.68\linewidth}
			\begin{figure}
				\centering
				\footnotesize
				\tikzstyle{serviceA}=[rectangle,draw,ultra thick,fill=blue!40]
				\tikzstyle{serviceB}=[rectangle,draw,ultra thick,fill=blue!10]
				\tikzstyle{db}=[circle,draw,ultra thick,fill=red!20]
				\tikzstyle{dbA}=[circle,draw,ultra thick,fill=blue!40]
				\tikzstyle{dbB}=[circle,draw,ultra thick,fill=blue!10]
				\tikzstyle{explaination}=[]
				\tikzstyle{point}=[coordinate]
				\begin{tikzpicture}[node distance=20mm,
							auto,>=latex',
							thin,
							start chain=going below,
							every join/.style={norm},
							invisible/.style={opacity=0},
  							visible on/.style={alt={#1{}{invisible}}},
  							alt/.code args={<#1>#2#3}{%
    							\alt<#1>{\pgfkeysalso{#2}}{\pgfkeysalso{#3}} % \pgfkeysalso doesn't change the path
  						},]
					\node[serviceA] (serviceA) at (0,0) {serviceA};
					\node[explaination,visible on=<1-1>] (s0a) at (-1,0) {$s_0$};
					\node[explaination,visible on=<2-4>] (s1a) at (-1,0) {$s_1$};
					\node[explaination,visible on=<5-5>] (s2a) at (-1,0) {$s_2$};
					\node[explaination,visible on=<6->] (s3a) at (-1,0) {$s_3$};
					\node[serviceB] (serviceB) at (4.5,0) {serviceB};
					\node[explaination,visible on=<1-1>] (s0b) at (5.5,0) {$s_0$};
					\node[explaination,visible on=<2-4>] (s1b) at (5.5,0) {$s_1$};
					\node[explaination,visible on=<5-5>] (s2b) at (5.5,0) {$s_2$};
					\node[explaination,visible on=<6->] (s3b) at (5.5,0) {$s_3$};
					\node[db] (db1) at (0,-4.5) {db1};
					\node[dbA,visible on=<3->] (db1a) at (0,-4.5) {db1};
					\node[explaination,visible on=<1-2>] (s01) at (-1,-4.5) {$s_0$};
					\node[explaination,visible on=<3-3>] (s11) at (-1,-4.5) {$s_1$};
					\node[explaination,visible on=<4->] (s21) at (-1,-4.5) {$s_2$};
					\node[db] (db2) at (4.5,-4.5) {db2};
					\node[dbB,visible on=<3->] (db2b) at (4.5,-4.5) {db2};
					\node[explaination,visible on=<1-2>] (s02) at (5.5,-4.5) {$s_0$};
					\node[explaination,visible on=<3-3>] (s12) at (5.5,-4.5) {$s_3$};
					\node[explaination,visible on=<4->] (s22) at (5.5,-4.5) {$s_4$};
					\node[explaination,visible on=<6->] (error0) at (0.7,-4.5) {$\times$};
					\node[explaination,visible on=<6->] (error1) at (3.8,-4.5) {$\times$};
					\node[point] (errorp0) at (0.7,-4.5) {};
					\node[point] (errorp1) at (3.8,-4.5) {};

					\draw[<-,visible on=<2->] (db1.north) to[out=120,in=240] node {1 getA} (serviceA.south);
					\draw[<-,visible on=<4->] (serviceA.south) to node {2 returnA} (db1.north);
					\draw[->,dashed,draw=red,visible on=<6->] (serviceA.south) to[out=0,in=180] node {3 getA} (errorp1);
					\draw[<-,visible on=<2->] (db2.north) to node {1 getB} (serviceB.south);
					\draw[<-,visible on=<4->] (serviceB.south) to[in=60,out=300] node {returnB} (db2.north);
					\draw[->,dashed,draw=red,visible on=<6->] (serviceB.south)  to[out=180,in=0] node {3 getB} (errorp0);

				\end{tikzpicture}
			\end{figure}
		\end{minipage}
		\pause
		\begin{minipage}[t]{0.3\linewidth}
			\footnotesize
			\begin{equation*}
				\begin{split}
					serviceB:&s_3\xLongrightarrow{successB} s_4\\
					serviceA:&s_3\xLongrightarrow{successA} s_4\\
					db1:&s_2\xLongrightarrow{clearA} s_0\\
					db2:&s_4\xLongrightarrow{clearB} s_0
				\end{split}
			\end{equation*}
		\end{minipage}
	\end{figure}
tikzpicture环境中加入invisible/.style,visible on/.style,alt/.code args的定义,在node和draw定义里加入visible on=<1-2>表示在slide1到2中显示该元素。


 3万+
3万+


 被折叠的 条评论
为什么被折叠?
被折叠的 条评论
为什么被折叠?
 到【灌水乐园】发言


