


1. 聚类时常被用于数据量很大(data-intensive)的应用中。
2. 聚类是无监督学习(unsupervised learning)的一个例子。无监督学习算法并不利用带有正确答案的样本数据进行“训练”,它们的目的是要在一组数据中找寻某种结构,而这些数据本身并不是我们要找的答案。
3. 聚类的结果不会告诉零售商每位顾客可能会买什么,也不会预测新来的顾客适合哪种时尚,聚类算法的目标是采集数据,然后从中找出不同的数组。
例如:可以通过聚类来对博客用户进行分类
这个说法的假设前提是:我们有众多的博客用户,但这些用户并没有显著的特征标签,在这种情况下,如何有效的对这些用户进行分类。这时候聚类就派上用场了。
基本过程:
1. 构建一个博客订阅源列表
2. 利用订阅源列表建立一个单词列表,将其实际用于针对每个博客的单词计数。
3. 我们利用上述单词列表和博客列表来建立一个文本文件,其中包含一个大的矩阵,记录者针对每个博客的所有单词的统计情况。(例如:可以用列对应单词,用行对应博客),一个可用的代码如下:
import feedparser
import re

# Returns title and dictionary of word counts for an RSS feed
def getwordcounts(url):
  # Parse the feed
  d=feedparser.parse(url)
  wc={}

  # Loop over all the entries
  for e in d.entries:
    if 'summary' in e: summary=e.summary
    else: summary=e.description

    # Extract a list of words
    words=getwords(e.title+' '+summary)
    for word in words:
      wc.setdefault(word,0)
      wc[word]+=1
  return d.feed.title,wc

def getwords(html):
  # Remove all the HTML tags
  txt=re.compile(r'<[^>]+>').sub('',html)

  # Split words by all non-alpha characters
  words=re.compile(r'[^A-Z^a-z]+').split(txt)

  # Convert to lowercase
  return [word.lower() for word in words if word!='']
4. 当然这里有很多可以减少需要统计的单词量的技巧,有些常用的习惯性用于可以从这些列表中删除掉。具体的构建过程这里省略不谈,感兴趣的可以参考相关书籍。
5. 进行聚类:这里有两种可用的方法
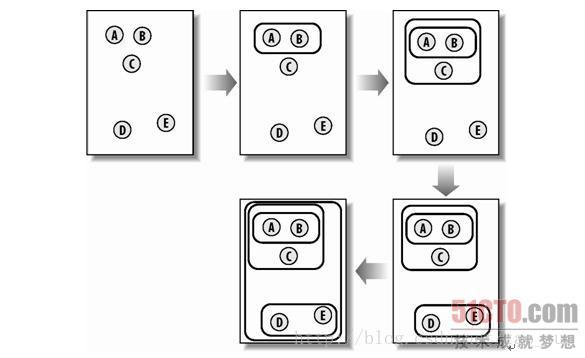
分级聚类:
分级聚类通过连续不断地将最为相似的群组两两合并,直到只剩一个群组为止,来构造出一个群组的层级结构。其过程可以参考下图:
分级聚类基本算法如下:(这里省略了一些细节函数,如加载文件,计算皮尔逊相似度等)
def hcluster(rows,distance=pearson):
  distances={}
  currentclustid=-1

  # Clusters are initially just the rows
  clust=[bicluster(rows[i],id=i) for i in range(len(rows))]

  while len(clust)>1:
    lowestpair=(0,1)
    closest=distance(clust[0].vec,clust[1].vec)

    # loop through every pair looking for the smallest distance
    for i in range(len(clust)):
      for j in range(i+1,len(clust)):
        # distances is the cache of distance calculations
        if (clust[i].id,clust[j].id) not in distances:
          distances[(clust[i].id,clust[j].id)]=distance(clust[i].vec,clust[j].vec)

        d=distances[(clust[i].id,clust[j].id)]

        if d<closest:
          closest=d
          lowestpair=(i,j)

    # calculate the average of the two clusters
    mergevec=[
    (clust[lowestpair[0]].vec[i]+clust[lowestpair[1]].vec[i])/2.0
    for i in range(len(clust[0].vec))]

    # create the new cluster
    newcluster=bicluster(mergevec,left=clust[lowestpair[0]],
                         right=clust[lowestpair[1]],
                         distance=closest,id=currentclustid)

    # cluster ids that weren't in the original set are negative
    currentclustid-=1
    del clust[lowestpair[1]]
    del clust[lowestpair[0]]
    clust.append(newcluster)

  return clust[0]
待分级聚类完成后,我们可以采用一种图形化的方式来展现所得的结果,这种图被称为树状图(dendrogram),如下图所示。例如:我们针对博客数据进行聚类,以构造博客的层级结构,如果构造成功,我们将实现按主题对博客进行分组。
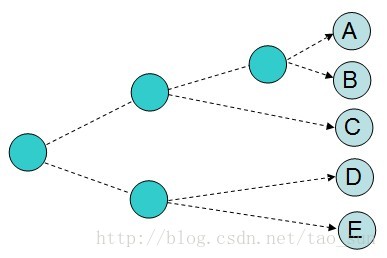
图:树状图(图片来自网络)
树状图的绘制,可以使用一个Python包:Python Imaging Library(PIL)
借助PIL,我们可以非常轻松地生成带有文本和线条的图形。
from PIL import Image,ImageDraw 此外,还必须知道节点的总体误差。萧条的长度会根据每个节点的误差进行相应的调整,所以我们需要根据总的误差值生成一个缩放因子scaling factor.
对于绘制的图形,线条越长就越表明,合并在一起的两个聚类差别很大,线条越短,则表示两个聚类的相似度很高。
K-均值聚类:
分级聚类的结果为我们返回了一棵形象直观的树。但存在两个缺点:
1. 没有额外投入的情况下,树形视图是不会真正将数据拆分成不同组的
2. 算法的计算量非常大,大数据集情况下,速度很慢
K-均值聚类:
预先告诉速算法希望生成的聚类数量,然后算法会根据数据的结构状况来确定聚类的大小。
算法首先会随机确定K个中心位置,然后将各个数据项分配给最临近的中心点。待分配完成之后,聚类中心就会移到分配给该聚类的所有节点的平均位置处,然后整个分配过程重新开始。这一过程会一直重复下去,知道分配过程不再产生变化为止。
代码如下:
import random

def kcluster(rows,distance=pearson,k=4):
  # Determine the minimum and maximum values for each point
  ranges=[(min([row[i] for row in rows]),max([row[i] for row in rows]))
  for i in range(len(rows[0]))]

  # Create k randomly placed centroids
  clusters=[[random.random()*(ranges[i][1]-ranges[i][0])+ranges[i][0]
  for i in range(len(rows[0]))] for j in range(k)]

  lastmatches=None
  for t in range(100):
    print 'Iteration %d' % t
    bestmatches=[[] for i in range(k)]

    # Find which centroid is the closest for each row
    for j in range(len(rows)):
      row=rows[j]
      bestmatch=0
      for i in range(k):
        d=distance(clusters[i],row)
        if d<distance(clusters[bestmatch],row): bestmatch=i
      bestmatches[bestmatch].append(j)

    # If the results are the same as last time, this is complete
    if bestmatches==lastmatches: break
    lastmatches=bestmatches

    # Move the centroids to the average of their members
    for i in range(k):
      avgs=[0.0]*len(rows[0])
      if len(bestmatches[i])>0:
        for rowid in bestmatches[i]:
          for m in range(len(rows[rowid])):
            avgs[m]+=rows[rowid][m]
        for j in range(len(avgs)):
          avgs[j]/=len(bestmatches[i])
        clusters[i]=avgs

  return bestmatches
其过程如下图所示:
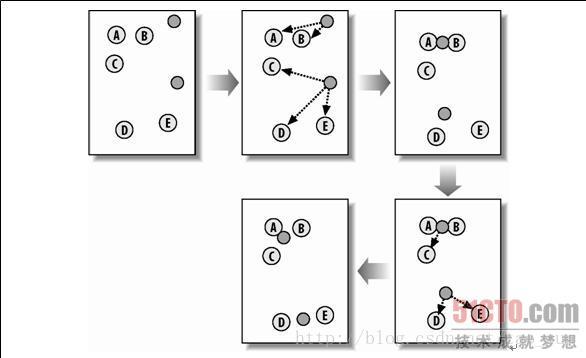
图:K-均值聚类
参考:集体智慧编程,ch3发现群组


 504
504


 被折叠的 条评论
为什么被折叠?
被折叠的 条评论
为什么被折叠?
 到【灌水乐园】发言


