


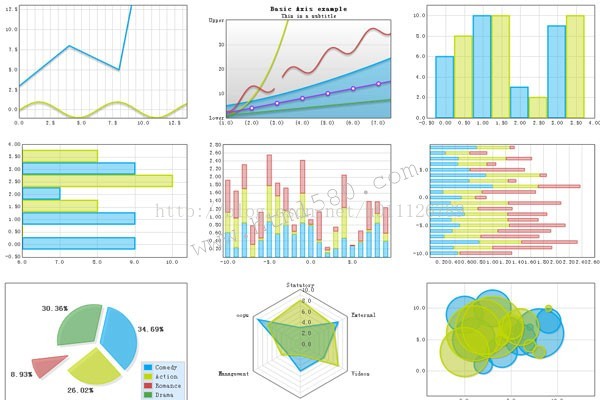
给大家介绍一下怎样使用绘制HTML5图表和图形库Flotr2,我们知道Flotr2是一个绘制HTML5图表和图形库。改进flotr的一个分支。
<html>
  <head>
    <style type="text/css">
      body {
        margin: 0px;
        padding: 0px;
      }
      #container {
        width : 600px;
        height: 384px;
        margin: 8px auto;
      }
    </style>
  </head>
  <body>
    <div id="container"></div>
    <!--[if IE]>
    <script type="text/javascript" src="/static/lib/FlashCanvas/bin/flashcanvas.js"></script>
    <![endif]-->
    <script type="text/javascript" src="/static/js/flotr2.min.js"></script>
    <script type="text/javascript">
      (function () {

        var
          container = document.getElementById('container'),
          start = (new Date).getTime(),
          data, graph, offset, i;

        // Draw a sine curve at time t
        function animate (t) {

          data = [];
          offset = 2 * Math.PI * (t - start) / 10000;

          // Sample the sine function
          for (i = 0; i < 4 * Math.PI; i += 0.2) {
            data.push([i, Math.sin(i - offset)]);
          }

          // Draw Graph
          graph = Flotr.draw(container, [ data ], {
            yaxis : {
              max : 2,
              min : -2
            }
          });

          // Animate
          setTimeout(function () {
            animate((new Date).getTime());
          }, 50);
        }

        animate(start);
      })();
    </script>
  </body>
</html>


 382
382


 被折叠的 条评论
为什么被折叠?
被折叠的 条评论
为什么被折叠?
 到【灌水乐园】发言


