


1、Itext简介
iText是著名的开放源码的站点sourceforge一个项目,是用于生成PDF文档的一个java类库。通过iText不仅可以生成PDF或rtf的文档,而且可以将XML、Html文件转化为PDF文件。 iText的安装非常方便,下载iText.jar文件后,只需要在系统的CLASSPATH中加入iText.jar的路径,在程序中就可以使用iText类库了。
Itext对word操作就像poi对Excel的操作一样,功能丰富。
2、Itext使用
(1)创建Document
就像新建Word文档一样,你只需要用Document document = new Document(PageSize.A4);创建一个Document对象。
注意:
PageSize.A4 设置word纸张大小,除此之外还有其他参数,一下为Itext的介绍
com.lowagie.text.Document.Document(Rectangle arg0, float marginLeft, float marginRight, float marginTop, float marginBottom)
第一个参数为设置纸张大小,如PageSize.A4
后面的四个float参数为设置word的页面左右上下边距
(2)创建对象后需要创建文档读写器
RtfWriter2.getInstance(document, new FileOutputStream(file));
建立一个书写器(Writer)与document对象关联,通过书写器(Writer)可以将文档写入到磁盘中。其中file为保存路径和文档名称如D:/test.doc。然后就是
document.open();打开文档进行读写
(3)文档添加元素
通过document.add()向文档中添加内容,添加的内容必须是Element元素,如Paragraph、Image、Table等常用元素。他们分别是文本段落、图片、表格。
①添加段落
创建段落对象Paragraph theme = new Paragraph(companyTheme);参数为String类型,常用属性设置:
设置位置:theme.setAlignment(Element.ALIGN_CENTER);参数为居中、居左、居右
设置前后距离:相当于行距theme.setSpacingBefore(90)、theme.setSpacingAfter(0)
设置字体:包括字体的大小、颜色、字体类型等。通过theme.setFont(ThemeFont);设置字体他需要Font类型的参数
创建Font对象,通过font设置字体
Font ThemeFont = new Font(setBaseFont(), 18, Font.BOLD);
// 设置标题字体的颜色
ThemeFont.setColor(new Color(0, 0, 129));
而Font需要BaseFont参数对象,创建BaseFont对象来设置字体,如:微软雅黑等
BaseFont macintosh =
BaseFont.createFont(“D:\201404042\ywsf.ttf”,
BaseFont.IDENTITY_H, BaseFont.EMBEDDED);
在网上有看到说Itext不能设置字体,是不对的通过basefont可以随意设置自己想要的字体。
②创建Table对象
Table table1 = new Table(4);// 创建该表格的列数,在本程序中设为4列
int width1[] = { 30, 30, 30, 30 };// 每列的单元格的宽度
table1.setWidths(width1);// 设置每列所占比例
table1.setWidth(90); // 占页面宽度 90%,相当于html中width属性
table1.setAlignment(Element.ALIGN_CENTER);//设置该表格中的元素水平方向居中显示
table1.setAutoFillEmptyCells(true); // 自动填满
table1.setBorderWidth(1); // 边框宽度
table1.setBorderColor(new Color(160, 32, 240)); // 边框颜色
通过table1.addCell()向表格中添加元素元素可以是cell对象也可以是字符串、也可以是图片,如果添加图片的话需要Image对象获取图片。如:
Image img = Image.getInstance(“d:/img.png”);
Cell cell = new Cell(img);
table1.addCell(cell);
项目中的效果如下:利用Jfreechart统计图和Itext结合生成的
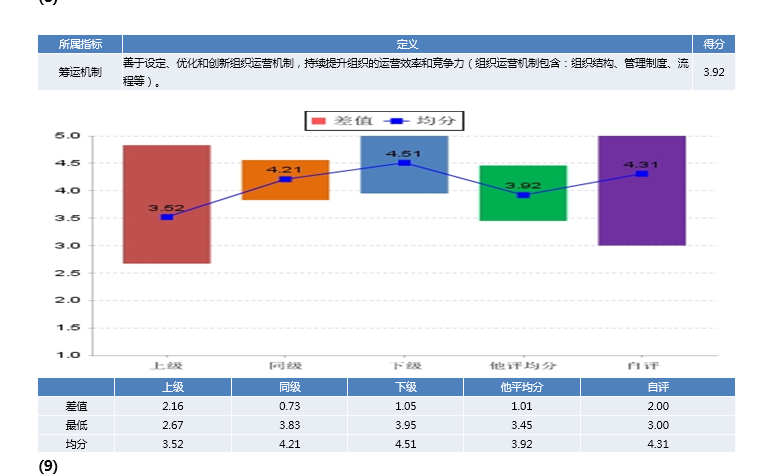
然后可以通过document.add()添加到文档中。用到table需要设置它的属性如常用的合并单元格、设置背景色如下图设置:通过设置cell.setColspan(int num); cell.setRowspan(int num);设置单元格的合并。和常用的设置背景border一样background、color 、border等设置
最后关闭document读写document.close();
以下是一个完整的小Demo根据实际调整代码运行。FontSettingC为自定义的设置样式。
Jfreechart生成图参考前面的案例。
package com.lizj_cdoc.exp;
import java.io.FileOutputStream;
import java.io.IOException;
import java.net.MalformedURLException;
import java.util.HashMap;
import java.util.LinkedHashMap;
import org.jfree.data.category.CategoryDataset;
import org.jfree.data.category.DefaultCategoryDataset;
import com.lizj_cdoc.Utils.FontSettingC;
import com.lizj_cdoc.jfreechart.CreateChart;
import com.lizj_cdoc.jfreechart.CreateJfreeBarChart;
import com.lizj_cdoc.jfreechart.CreateTable;
import com.lowagie.text.BadElementException;
import com.lowagie.text.Document;
import com.lowagie.text.DocumentException;
import com.lowagie.text.Element;
import com.lowagie.text.Image;
import com.lowagie.text.PageSize;
import com.lowagie.text.rtf.RtfWriter2;
public class ExpModelPersonal {
public void createDocFile(String file) throws DocumentException,
IOException {
// 设置纸张大小
Document document = new Document(PageSize.A4);
// 建立一个书写器(Writer)与document对象关联,通过书写器(Writer)可以将文档写入到磁盘中
RtfWriter2.getInstance(document, new FileOutputStream(file));
document.open();
// 将Phrases添加到document文档
document.add(FontSettingC.setFirstTitle(“报告目录”));
document.add(FontSettingC
.setSecondTitle(“(一)领导力行为指标\n” +
“(二)评估整体概况\n” +
“(三)优势与待发展\n” +
“(四)自我认知偏差\n” +
“(五)他评分歧(他评差异大的行为;不同人眼中表现突出的行为)\n” +
“(六)发展建议\n” +
“(七)行动计划\n” +
“(八)附录:文本题反馈\n” +
“(九)附录:得分详情\n”));
              document.add(getTargetSpread());
            document.close();
}

public static Image setImage(String url)
        throws BadElementException, MalformedURLException, IOException {
    // 添加图片
    Image img_spider = Image.getInstance(url);
    // 设置图片大小(H,W)
        img_spider.scaleAbsolute(300, 130);
    img_spider.setAlignment(Element.ALIGN_CENTER);
    img_spider.setSpacingBefore(50);
    return img_spider;
}
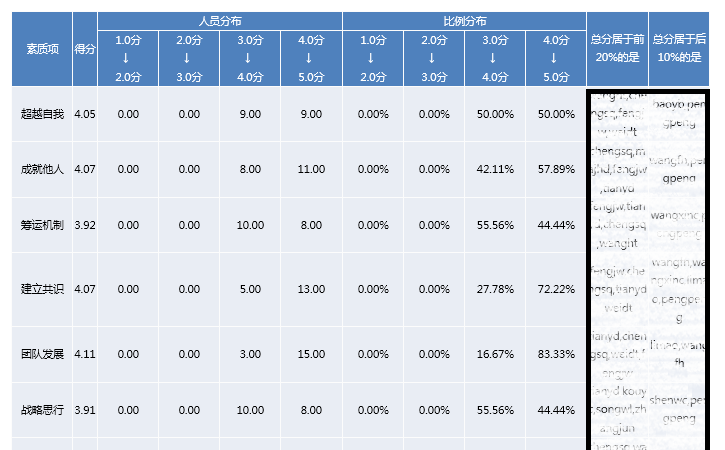
public static Table getTargetSpread() throws DocumentException,
IOException, ParseException {
Table table1 = new Table(12);// 创建该表格的列数,在本程序中设为5列
int width1[] = { 25, 10, 25, 25, 25, 25, 25, 25, 25, 25, 25, 25 };// 每列的单元格的宽度
table1.setWidths(width1);// 设置每列所占比例
table1.setWidth(100); // 占页面宽度 90%,相当于html中width属性
table1.setAlignment(Element.ALIGN_CENTER);// 设置该表格中的元素水平方向居中显示
table1.setAutoFillEmptyCells(true); // 自动填满
table1.setBorderColor(new Color(160, 32, 240)); // 边框颜色
table1.addCell(ItextTableStyle.DeepBlueRowSpan(“素质项”, 2));
table1.addCell(ItextTableStyle.DeepBlueRowSpan(“得分”, 2));
table1.addCell(ItextTableStyle.deepBlue(“人员分布”, 4));
table1.addCell(ItextTableStyle.deepBlue(“比例分布”, 4));
table1.addCell(ItextTableStyle.DeepBlueRowSpan(“总分居于前20%的是”, 2));
table1.addCell(ItextTableStyle.DeepBlueRowSpan(“总分居于后10%的是”, 2));
table1.addCell(ItextTableStyle.DeepBlueRowSpan(“1.0分\n↓\n2.0分”, 1));
table1.addCell(ItextTableStyle.DeepBlueRowSpan(“2.0分\n↓\n3.0分”, 1));
table1.addCell(ItextTableStyle.DeepBlueRowSpan(“3.0分\n↓\n4.0分”, 1));
table1.addCell(ItextTableStyle.DeepBlueRowSpan(“4.0分\n↓\n5.0分”, 1));
table1.addCell(ItextTableStyle.DeepBlueRowSpan(“1.0分\n↓\n2.0分”, 1));
table1.addCell(ItextTableStyle.DeepBlueRowSpan(“2.0分\n↓\n3.0分”, 1));
table1.addCell(ItextTableStyle.DeepBlueRowSpan(“3.0分\n↓\n4.0分”, 1));
table1.addCell(ItextTableStyle.DeepBlueRowSpan(“4.0分\n↓\n5.0分”, 1));
Cell cell = new Cell(setImage(“d:/img.png”));
Cell. setColspan (12);
table1.addCell(cell);
}
}


 2381
2381


 被折叠的 条评论
为什么被折叠?
被折叠的 条评论
为什么被折叠?
 到【灌水乐园】发言


