


Suricata uses the Yaml format for configuration. The Suricata.yaml file included in the source code, is the example configuration of Suricata. This document will explain each option.
At the top of the YAML-file you will find % YAML 1.1. Suricata reads the file and identifies the file as YAML.
Max-pending-packets
With the max-pending-packets setting you can set the number of packets you allow Suricata to process simultaneously.
This can range from one packet to tens of thousands/hundreds of thousands of packets.
It is a trade of higher performance and the use of more memory (RAM), or lower performance and less use of memory. A high number of packets being processed results in a higher performance and the use of more memory. A low number of packets, results in lower performance and less use of memory.
Choosing a low number of packets being processed while having many CPU's/CPU cores, can result in not making use of the whole computer-capacity. (For instance: using one core while having three waiting for processing packets.)
Runmodes
By default the runmode option is disabled
With the runmodes setting you can set the runmode you would like to use. For all runmodes available, enter --list-runmodes in your command line. For more information, see Runmodes.
Default-packet-size
For the max-pending-packets option, Suricata has to keep packets in memory. With the default-packet-size option, you can set the size of the packets on your network. It is possible that bigger packets have to be processed sometimes. The engine can still process these bigger packets, but processing it will lower the performance.
User and group
It is possible to set the user and group to run Suricata as:
Action-order
All signatures have different properties. One of those is the Action property. This one determines what will happen when a signature matches.
There are four types of Action. A summary of what will happen when a signature matches and contains one of those Actions:
1) Pass
If a signature matches and contains pass, Suricata stops scanning the packet and skips to the end of all rules (only for the current packet).
2) Drop
This only concerns the IPS/inline mode.
If the program finds a signature that matches, containing drop, it stops immediately. The packet will not be sent any further.
Drawback: The receiver does not receive a message of what is going on, resulting in a time-out (certainly with TCP). Suricata generates an alert for this packet.
3) Reject
This is an active rejection of the packet. Both receiver and sender receive a reject packet. There are two types of reject packets that will be automatically selected. If the offending packet concerns TCP, it will be a Reset-packet. For all other protocols it will be an ICMP-error packet. Suricata also generates an alert. When in Inline/IPS mode, the offending packet will also be dropped like with the 'drop' action.
4) Alert
If a signature matches and contains alert, the packet will be treated like any other non-threatening packet, except for this one an alert will be generated by Suricata. Only the system administrator can notice this alert.
Inline/IPS can block network traffic in two ways. One way is by drop and the other by reject.
Rules will be loaded in the order of which they appear in files. But they will be processed in a different order. Signatures have different priorities. The most important signatures will be scanned first. There is a possibility to change the order of priority. The default order is: pass, drop, reject, alert.
This means a pass rule is considered before a drop rule, a drop rule before a reject rule and so on.
Splitting configuration in multiple files
Some users might have a need or a wish to split their suricata.yaml file in to seperate files, this is available vis the 'include' and '!include' keyword. The first example is of taking the contents of the outputs section and storing them in outputs.yaml
The second scenario is where multiple sections are migrated to a different YAML file.
If the same section, say outputs is later redefined after the include statement it will overwrite the included file. Therefor any include statement at the end of the document will overwrite the already configured sections.
Event output
Default logging directory
In the /var/log/suricata directory, all of Suricata's output (alerts and events) will be stored.
This directory can be overridden by entering the -l command line parameter or by changing the directory directly in Yaml. To change it with the -l command line parameter, enter the following:
Outputs
There are several types of output. The general structure is:
Enabling all of the logs, will result in a much lower performance and the use of more disc space, so enable only the outputs you need.
Line based alerts log (fast.log)
This log contains alerts consisting of a single line.
Example of the appearance of a single fast.log-file line:
Eve (Extensible Event Format)
This is an JSON output for alerts and events. It allows for easy integration with tools like logstash.
For more advanced configuration options, see EveJSONOutput .
The format is documented in EveJSONFormat
Log output for use with Barnyard (unified.log)
This log only supports IPv4. Its information will be stored in the default logging directory.
This log is designed to be stored in a binary format on the hard disc, where it will be further processed by Barnyard. Barnyard can store the output in a database, so Suricata can work on other important tasks. Barnyard can add the files in the Mysql-database, send them to Sguil or several other output options.
There is a size-limit to the log-file: If Suricata generates an alert, it stores this alert in a unified-file. Suricata keeps continuing doing that, until the file has reached its limit. Which in the default case is at 32 MB. At that point Suricata generates a new file and the process starts all over again. Barnyard keeps on processing these files. To prevent Suricata from filling up the hard disc, a size limit is enforced. When the limit is reached, the file will 'role-over', creating a new file. Barnyard removes old files. To every file, Suricata adds a time stamp, so it is easy to see which one came first and which one is the latter.
This output option has been removed in Suricata 1.1rc1 (see ticket #353).
Alert output for use with Barnyard (unified.alert)
This log only supports IPv4. Its information will be stored in the default logging directory.
For further information read the above information about ( 2) unified.log)
This output option has been removed in Suricata 1.1rc1 (see ticket #353).
Alert output for use with Barnyard2 (unified2.alert)
This log also supports IPv6 in addition to IPv4. It's information will be stored in the default logging directory.
For further information read the above information about 2. unified.log.
This alert output needs Barnyard2.
A line based log of HTTP requests (http.log)
This log keeps track of all HTTP-traffic events. It contains the HTTP request, hostname, URI and the User-Agent. This information will be stored in the http.log (default name, in the suricata log directory). This logging can also be performed through the use of the Eve-log capability.
Example of a HTTP-log line with non-extended logging:
Example of a HTTP-log line with extended logging:
A line based log of DNS queries and replies (dns.log)
This log keeps track of all DNS events (queries and replies). It contains the type of DNS activity that has been performed, the requested / replied domain name and relevant data suck as client, server, ttl, resource record data. This logging can also be performed through the use of the Eve-log capability which offers easier parsing.
Example of the apperance of a DNS log of a query with a preceding reply:
Non-existant domains and other DNS errors are recorded by the text representation of the rcode field in the reply (see RFC1035 and RFC2136 for a list). In the example below a non-existent domain is resolved and the NXDOMAIN error logged:
Configuration options:
Packet log (pcap-log)
With the pcap-log option you can save all packets, that are registered by Suricata, in a log file named log.pcap. This way, you can take a look at all packets whenever you want.
In the normal mode a pcap file is created in the default-log-dir. It can also be created elsewhere if a absolute path is set in the yaml-file.
The file that is saved in example the default -log-dir /var/log/suricata, can be be opened with every program which supports the pcap file format. This can be Wireshark, TCPdump, Suricata, Snort and many others.
The pcap-log option can be enabled and disabled.
There is a size limit for the pcap-log file that can be set. The default limit is 32 MB. If the log-file reaches this limit, the file will be rotated and a new one will be created.
The pcap-log option has an extra functionality for Sguil that can be enabled in the 'mode' option.
In the sguil mode the "sguil_base_dir" indicates the base directory. In this base dir the pcaps are created in a Sguil-specific directory structure that is based on the day:
If you would like to use Suricata with Sguil, do not forget to enable (and if necessary modify) the base dir in the suricata.yaml file.
Remember that in the 'normal' mode, the file will be saved in default-log-dir or in the absolute path (if set).
By default all packets are logged except:
- TCP streams beyond stream.reassembly.depth
- encrypted streams after the key exchange
Verbose Alerts Log (alert-debug.log)
This is a log type that gives supplementary information about an alert. It is particularly convenient for people who investigate false positives and who write signatures. However, it lowers the performance because of the amount of information it has to store.
Alert output to prelude (alert-prelude)
To be able to use this type, you have to connect with the prelude manager first.
Prelude alerts contain a lot of information and fields, including the IPfields in of the packet which triggered the alert. This information can be divided in three parts:
- The alert description (sensor name, date, ID (sid) of the rule, etc). This is always included
- The packets headers (almost all IP fields, TCP UDP etc. if relevant)
- A binary form of the entire packet.
Since the last two parts can be very big (especially since they are stored in the Prelude SQL database), they are optional and controlled by the two options 'log_packet_header' and 'log_packet_content'. The default setting is to log the headers, but not the content.
The profile name is the name of the Prelude profile used to connect to the prelude manager. This profile must be registered using an external command (prelude-admin), and must match the uid/gid of the user that will run Suricata. The complete procedure is detailed in the Prelude Handbook
Stats
In stats you can set the options for stats.log.
When enabling stats.log you can set the amount of time in seconds after which you want the output-data to be written to the log file.
Syslog
With this option it is possible to send all alert and event output to syslog.
Drop.log, a line based information for dropped packets
If Suricata works in IPS mode, it can drop packets based on rules. Packets that are being dropped are saved in the drop.log file, a Netfilter log format.
Detection engine
Inspection configuration
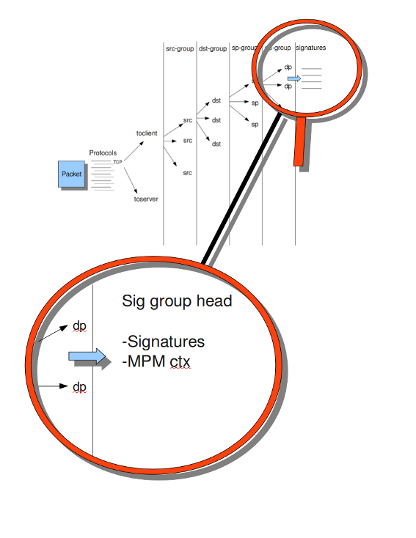
The detection-engine builds internal groups of signatures. Suricata loads signatures, with which the network traffic will be compared. The fact is, that many rules certainly will not be necessary. (For instance: if there appears a packet with the UDP-protocol, all signatures for the TCP-protocol won't be needed.)
For that reason, all signatures will be divided in groups. However, a distribution containing many groups will make use of a lot of memory. Not every type of signature gets its own group. There is a possibility that different signatures with several properties in common, will be placed together in a group.
The quantity of groups will determine the balance between memory and performance. A small amount of groups will lower the performance yet uses little memory. The opposite counts for a higher amount of groups. The engine allows you to manage the balance between memory and performance. To manage this, (by determining the amount of groups) there are several general options:high for good performance and more use of memory, low for low performance and little use of memory. The option medium is the balance between performance and memory usage. This is the default setting.The option custom is for advanced users. This option has eight values which can be managed by the user.
At all of these options, you can add (or change) a value.
Most signatures have the adjustment to focus on one direction, meaning focusing exclusively on the server, or exclusively on the client.
If you take a look at example 4, the Detection-engine grouping tree, you see it has many branches. At the end of each branch, there is actually a 'sig group head'. Within that sig group head there is a container which contains a list with signatures that are significant for that specific group/that specific end of the branch. Also within the sig group head the settings for Multi-Pattern-Matcher (MPM) can be found: the MPM-context.
As will be described again at the part 'Pattern matching settings', there are several MPM-algorithms of which can be chosen from. Because every sig group head has its own MPM-context, some algorithms use a lot of memory. For that reason there is the option sgh-mpm-context to set whether the groups share one MPM-context, or to set that every group has its own MPM-context.
For setting the option sgh-mpm-context, you can choose from auto, full or single. The default setting is 'auto', meaning Suricata selects full or single based on the algorithm you use. 'Full' means that every group has its own MPM-context, and 'single' that all groups share one MPM-context.
The two algorithms ac and ac-gfbs are new in 1.03. These algorithms use a single MPM-context if the Sgh-MPM-context setting is 'auto'. The rest of the algorithms use full in that case.
The inspection-recursion-limit option has to mitigate that possible bugs in Suricata cause big problems. Often Suricata has to deal with complicated issues. It could end up in an 'endless loop' due to a bug, meaning it will repeat its actions over and over again. With the option inspection-recursion-limit you can limit this action.
Example 4 Detection-engine grouping tree

Example 5 Detail grouping tree
CUDA (Compute United Device Architecture)
Suricata utilizes CUDA for offloading CPU intensive tasks to the (NVIDIA) GPU (graphics processing unit). Suricata supports an experimental multi-pattern-matcher using CUDA.
Only if you have compiled Suricata with CUDA (by entering --enable-cuda in the configure stage) you can make use of these features.
There are several options for CUDA.
The option 'packet_buffer_limit' designates how many packets will be send to the GPU at the same time. Suricata sends packets in 'batches', meaning it sends multiple packets at once. As soon as Suricata has collected the amount of packets set in the 'packet_buffer_limit' option, it sends them to the GPU. The default amount of packets is 2400.
The option 'packet_size_limit' makes sure that packets with payloads bigger than a certain amount of bytes will not be send to the GPU. Other packets will be send to the GPU. The default setting is 1500 bytes.
The option 'packet_buffers' designates the amount of buffers that will be filled with packets and will be processed. Buffers contain the batches of packets. During the time these filled buffers are being processed, new buffers will be filled.
The option 'batching_timeout' can have all values higher than 0. If a buffers is not fully filled after a period of time (set in this option 'batching_timeout'), the buffer will be send to the GPU anyway.
The option 'page_locked' designates whether the page locked memory will or will not be used. The advantage of page locked memory is that it can not be swapped out to disk. You would not want your computer to use your hard disk for Suricata, because it lowers the performance a lot. In this option you can set whether you still want this for CUDA or not.
The option 'device_id' is an option within CUDA to determine which GPU should be turned to account.(If there is only one GPU present at your computer, there is no benefit making use of the 'device-id' option.)
To detect the id of your GPU's, enter the following in your command line:
With the option 'cuda_streams' you can determine how many cuda-streams should be used for asynchronous processing. All values > 0 are valid. For this option you need a device with Compute Capability > 1.0 and page_locked enabled to have any effect.
Pattern matcher settings
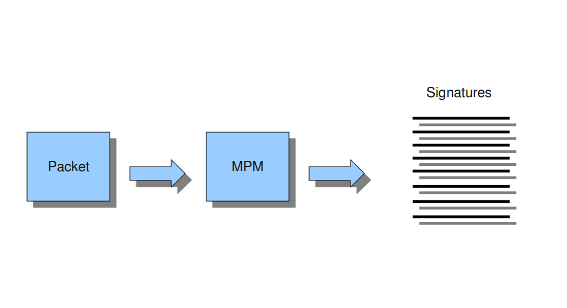
The multi-pattern-matcher (MPM) is a part of the detection engine within Suricata that searches for multiple patterns at once. Generally, signatures have one ore more patterns. Of each signature, one pattern is used by the multi-pattern-matcher. That way Suricata can exclude many signatures from being examined, because a signature can only match when all its patterns match.
These are the proceedings:
1)A packet comes in.
2)The packed will be analysed by the Multi-pattern-matcher in search of patterns that match.
3)All patterns that match, will be further processed by Suricata (signatures).
Example 8 Multi-pattern-matcher
Suricata offers various implementations of different multi-pattern-matcher algorithm's. These can be found below.
To set the multi-pattern-matcher algorithm:
After 'mpm-algo', you can enter one of the following algorithms: b2g, b2gc, b2gm, b3g, wumanber, ac and ac-gfbs (These last two are new in 1.0.3). For more information about these last two, please read again the the end of the part 'Detection engine'. These algorithms have no options, so the fact that below there is no option being mentioned is no omission.
Subsequently, you can set the options for the mpm-algorithm's.
The hash_size option determines the size of the hash-table that is internal used by the pattern matcher. A low hash-size (small table) causes lower memory usage, but decreases the performance. The opposite counts for a high hash-size: higher memory usage, but (generally) higher performance. The memory settings for hash size of the algorithms can vary from lowest (2048) - low (4096) - medium (8192) - high (16384) - higher (32768) – max (65536). (Higher is 'highest' in YAML 1.0 -1.0.2)
The bf_size option determines the size of the bloom filter, that is used with the final step of the pattern matcher, namely the validation of the pattern. For this option the same counts as for the hash-size option: setting it to low will cause lower memory usage, but lowers the performance. The opposite counts for a high setting of the bf_size: higher memory usage, but (generally) higher performance.
The bloom-filter sizes can vary from low (512) - medium (1024) - high (2048).
Threading
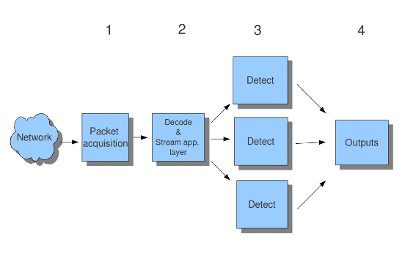
Suricata is multi-threaded. Suricata uses multiple CPU' s/CPU cores so it can process a lot of network packets simultaneously. (In a single-core engine, the packets will be processed one at a time.)
There are four thread-modules: Packet acquisition, decode and stream application layer, detection, and outputs.- The packet acquisition module reads packets from the network.
- The decode module decodes the packets and the stream application layer performs its job here. The stream application layer has three tasks:
- The detection threads will compare signatures. There can be several detection threads so they can operate simultaneously.
- In Outputs all alerts and events will be processed.
Example 6 Threading
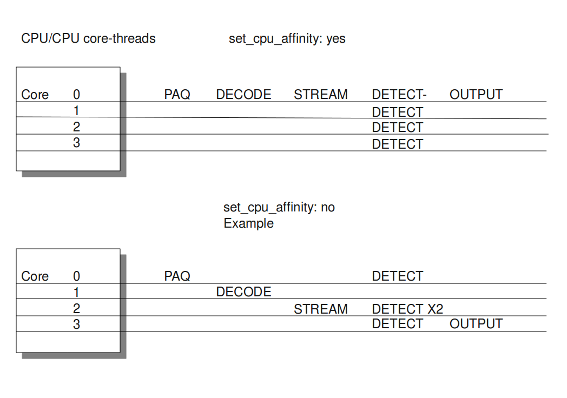
Most computers have multiple CPU's/ CPU cores. By default the operating system determines which core works on which thread. When a core is already occupied, another one will be designated to work on the thread. So, which core works on which thread, can differ from time to time.
There is an option within threading:
With this option you can cause Suricata setting fixed cores for every thread.
In that case 1, 2 and 4 are at core 0 (zero).
Each core has its own detect thread. The detect thread running on core 0 has a lower priority than the other threads running on core 0. If these other cores are to occupied, the detect thread on core 0 has not much packets to process. De detect threads running on other cores will process more packets.
This is only the case after setting the option at 'yes'.
Example 7 Balancing workload
You can set the detect-thread-ratio:
The detect thread-ratio will determine the amount of detect threads. By default it will be 1.5 x the amount of CPU's/CPU cores present at your computer. This will result in having more detection threads then CPU's/ CPU cores. Meaning you are oversubscribing the amount of cores. This may be convenient at times when there have to be waited for a detection thread. The remaining detection thread can become active.
In the option 'cpu affinity' you can set which CPU's/cores work on which thread. In this option there are several sets of threads. The management-, receive-, decode-, stream-, detect-, verdict-, reject- and outputs-set. These are fixed names and can not be changed. For each set there are several options: cpu, mode, and prio.
In the option 'cpu' you can set the numbers of the CPU's/cores which will run the threads from that set. You can set this option to 'all', use a range (0-3) or a comma separated list (0,1).
The option 'mode' can be set to 'balanced' or 'exclusive'. When set to 'balanced', the individual threads can be processed by all cores set in the option 'cpu'. If the option 'mode' is set to 'exclusive', there will be fixed cores for each thread.
As mentioned before, threads can have different priority's. In the option 'prio' you can set a priority for each thread. This priority can be low, medium, high or you can set the priority to 'default'. If you do not set a priority for a CPU, than the settings in 'default' will count.
By default Suricata creates one 'detect' thread per available CPU/CPU core.
Relevant cpu-affinity settings for IDS/IPS modes
IDS mode
- Runmode AutoFp
management-cpu-set - used for management (example - flow.managers, flow.recyclers)
recive-cpu-set - used for receive and decode
detect-cpu-set - used for streamtcp,detect,output(logging),reject
- Rumode Workers
management-cpu-set - used for management (example - flow.managers, flow.recyclers)
detect-cpu-set - used for receive,streamtcp,decode,detect,output(logging),respond/reject
IPS mode
- Runmode AutoFp
management-cpu-set - used for management (example - flow.managers, flow.recyclers)
recive-cpu-set - used for receive and decode
detect-cpu-set - used for streamtcp,detect,output(logging)
verdict-cpu-set - used for verdict and respond/reject
- Runmode Workers
management-cpu-set - used for management (example - flow.managers, flow.recyclers)
detect-cpu-set - used for receive,streamtcp,decode,detect,output(logging),respond/reject, verdict
IP Defrag
Occasionally network packets appear fragmented. On some networks it occurs more often than on others. Fragmented packets exist of many parts. Before Suricata is able to inspect these kind of packets accurately, the packets have to be reconstructed. This will be done by a component of Suricata; the defragment-engine. After a fragmented packet is reconstructed by the defragment-engine, the engine sends on the reassembled packet to rest of Suricata.
There are three options within defrag: max-frags, prealloc and timeout.
At the moment Suricata receives a fragment of a packet, it keeps in memory that other fragments of that packet will appear soon to complete the packet. However, there is a possibility that one of the fragments does not appear. To prevent Suricata for keeping waiting for that packet (thereby using memory) there is a timespan after which Suricata discards the fragments. This occurs by default after 60 seconds.
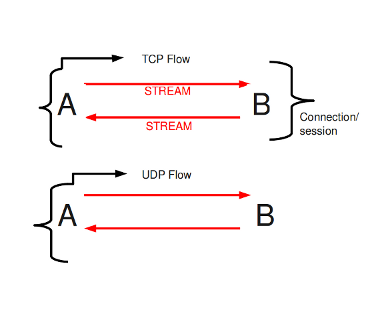
Flow and Stream handling
Flow Settings
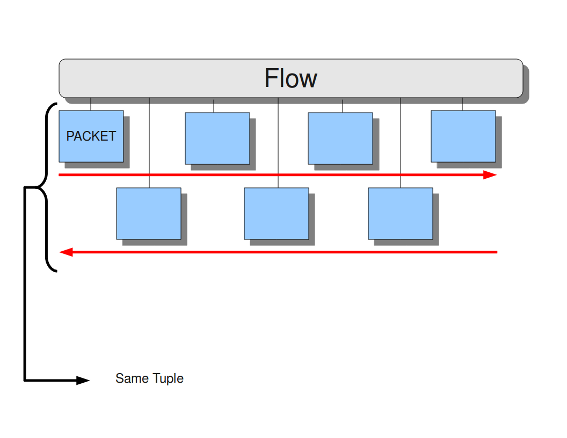
Within Suricata, Flows are very important. They play a big part in the way Suricata organizes data internally. A flow is a bit similar to a connection, except a flow is more general.All packets having the same Tuple (protocol, source IP, destination IP, source-port, destination-port), belong to the same flow. Packets belonging to a flow are connected to it internally.
Example 9 Flow
Example 10 Tuple
Keeping track of all these flows, uses memory. The more flows, the more memory it will cost.
To keep control over memory usage, there are several options:
The option memcap for setting the maximum amount of bytes the flow-engine will use, hash-size for setting the size of the hash-table and prealloc for the following:
For packets not yet belonging to a flow, Suricata creates a new flow. This is a relative expensive action. The risk coming with it, is that attackers /hackers can a attack the engine system at this part. When they make sure a computer gets a lot of packets with different tuples, the engine has to make a lot of new flows. This way, an attacker could flood the system. To mitigate the engine from being overloaded, this option instructs Suricata to keep a number of flows ready in memory. This way Suricata is less vulnerable to these kind of attacks.
The flow-engine has a management thread that operates independent from the packet processing. This thread is called the flow-manager. This thread ensures that wherever possible and within the memcap. there will be 10000 flows prepared.
At the point the memcap will still be reached, despite prealloc, the flow-engine goes into the emergency-mode. In this mode, the engine will make use of shorter time-outs. It lets flows expire in a more aggressive manner so there will be more space for new Flows.
There are two options: emergency_recovery and prune_flows. The emergency recovery is set on 30. This is the percentage of prealloc'd flows after which the flow-engine will be back to normal (when 30 percent of the 10000 flows is completed).
If during the emergency-mode, the aggressive time-outs do not have the desired result, this option is the final resort. It ends some flows even if they have not reached their time-outs yet. The prune-flows option shows how many flows there will be terminated at each time a new flow is set up.
Flow Time-Outs
The amount of time Suricata keeps a flow in memory is determined by the Flow time-out.
There are different states in which a flow can be. Suricata distinguishes three flow-states for TCP and two for UDP. For TCP, these are: New, Established and Closed,for UDP only new and established. For each of these states Suricata can employ different timeouts.
The state new in a TCP-flow, means the period during the three way handshake. The state established is the state when the three way handshake is completed. The state closed in the TCP-flow: there a several ways to end a flow. This is by means of Reset or the Four-way FIN handshake.
New in a UDP-flow: the state in which packets are send from only one direction.
Established in a UDP-flow: packets are send from both directions.
In the example configuration the are settings for each protocol. TCP, UDP, ICMP and default (all other protocols).
Stream-engine
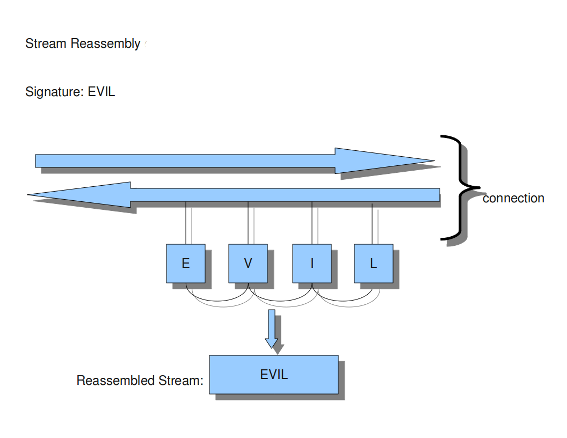
The Stream-engine keeps track of the TCP-connections. The engine exists of two parts: The stream tracking- and the reassembly-engine.
The stream-tracking engine monitors the state of a connection. The reassembly-engine reconstructs the flow as it used to be, so it will be recognised by Suricata.
The stream-engine has two memcaps that can be set. One for the stream-tracking-engine and one for the reassembly-engine.
The stream-tracking-engine keeps information of the flow in memory. Information about the state, TCP-sequence-numbers and the TCP window. For keeping this information, it can make use of the capacity the memcap allows.
TCP packets have a so-called checksum. This is an internal code which makes it possible to see if a packet has arrived in a good state. The stream-engine will not process packets with a wrong checksum. This option can be set off by entering 'no' instead of 'yes'.
The option 'max_sessions' is the limit for concurrent sessions. It prevents Suricata from using all memory for sessions.
To mitigate Suricata from being overloaded by fast session creation, the option prealloc_sessions instructs Suricata to keep a number of sessions ready in memory.
A TCP-session starts with the three-way-handshake. After that, data can be send en received. A session can last a long time. It can happen that Suricata will be running after a few sessions have already been started. This way, Suricata misses the original setup of those sessions. This setup always includes a lot of information. If you want Suricata to check the stream from that time on, you can do so by setting the option 'midstream' to 'true'. The default setting is 'false'.
Normally Suricata is able to see all packets of a connection. Some networks make it more complicated though. Some of the network-traffic follows a different route than the other part, in other words: the traffic goes asynchronous. To make sure Suricata will check the one part it does see, instead of getting confused, the option 'async-oneside' is brought to life. By default the option is set to 'false'.
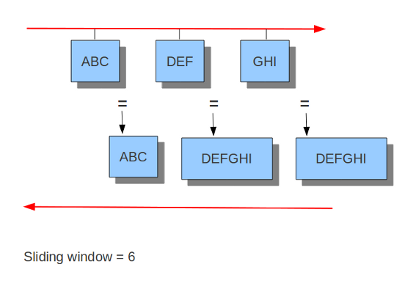
Suricata inspects content in the normal/IDS mode in chunks. In the inline/IPS mode it does that on the sliding window way (see example ..) In the case Suricata is set in inline mode, it has to inspect packets immediately before sending it to the receiver. This way Suricata is able to drop a packet directly if needed.(see example …) It is important for Suricata to note which operating system it is dealing with, because operating systems differ in the way they process anomalies in streams. See Host-os-policy in this suricata.yaml.
Example 11 Normal/IDS mode
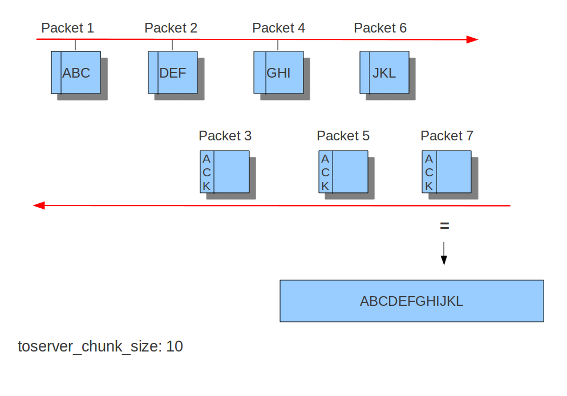
Suricata inspects traffic in chunks.
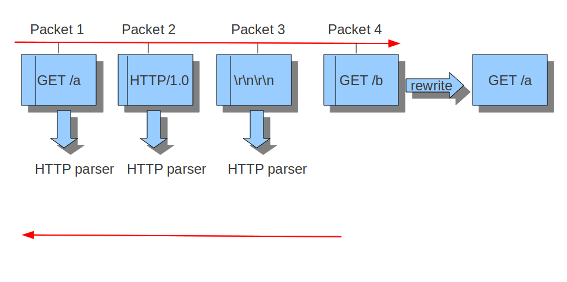
Example 12 Inline/IPS Sliding Window
Suricata inspects traffic in a sliding window manner.
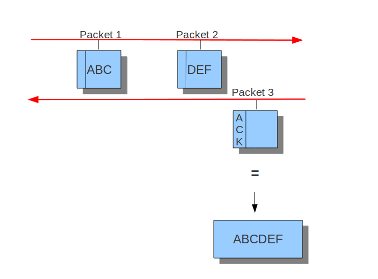
Example 13 Normal/IDS (reasembly on ACK'D data)
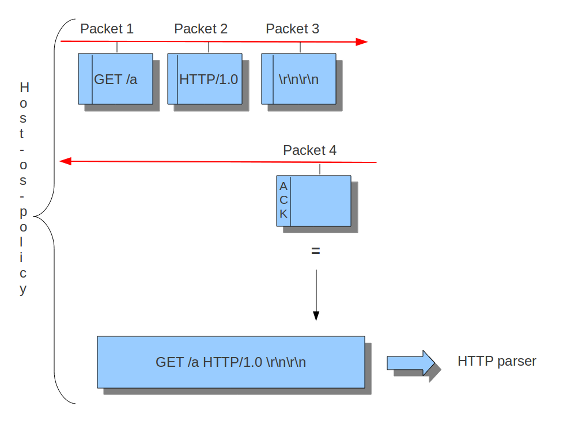
Example 14 Inline/IPS (reassembly on UNACK'D data)
The reassembly-engine has to keep packets in memory to be able to make a reassembled stream. It can make use of the amount of bytes set below. Reassembling a stream is an expensive operation. In the option depth you can set the depth (in a stream) of the reassembling. By default this is 1MB.
Example 15 Stream reassembly
Application Layer Parsers
Asn1_max_frames (new in 1.0.3 and 1.1)
Asn1 (Abstract Syntax One) is a standard notation to structure and describe data.
Within Asn1_max_frames there are several frames. To protect itself, Suricata will inspect a maximum of 256. You can set this amount differently if wanted.
Application layer protocols such as X.400 electronic mail, X.500 and LDAP directory services, H.323 (VoIP), BACnet and SNMP, use ASN.1 to describe the protocol data units (PDUs) they exchange. It is also extensively used in the Access and Non-Access Strata of UMTS.
Limit for the maximum number of asn1 frames to decode (default 256):
Configure HTTP (libhtp)
The library Libhtp is being used by Suricata to parse HTTP-sessions.
While processing HTTP-traffic, Suricata has to deal with different kind of servers which each process anomalies in HTTP-traffic differently. The most common web-server is Apache. This is a open source web -server program.
Beside Apache, IIS (Internet Information Services/Server)a web-server program of Microsoft is also well-known.
Like with host-os-policy, it is important for Suricata to which IP-address/network-address is used by which server. In Libhtp this assigning of web-servers to IP-and network addresses is called personality.
Currently Available Personalities:
Minimal
Generic
IDS (default)
IIS_4_0
IIS_5_0
IIS_5_1
IIS_6_0
IIS_7_0
IIS_7_5
Apache
Apache_2_2
You can assign names to each block of settings. Which in this case is -apache and -iis7. Under these names you can set IP-addresses, network-addresses the personality and the request-body-limit.
The version-specific personalities know exactly how web servers behave, and emulate that. The IDS personality (will be GENERIC in the future) would try to implement a best-effort approach that would work reasonably well in the cases where you do not know the specifics.
The default configuration also applies to every IP-address for which no specific setting is available.
HTTP request body's are often big, so they take a lot of time to process which has a significant impact on the performance. With the option 'request-body-limit' you can set the limit (in bytes) of the client-body that will be inspected. Setting it to 0 will inspect all of the body.
HTTP response body's are often big, so they take a lot of time to process which has a significant impact on the performance. With the option 'response-body-limit' you can set the limit (in bytes) of the server-body that will be inspected. Setting it to 0 will inspect all of the body.
As of 1.4, Suricata makes available the whole set of libhtp customisations for its users.
You can now use these parameters in the conf to customise suricata's use
of libhtp.
Engine output
Logging configuration
The logging subsystem can display all output except alerts and events. It gives information at runtime about what the engine is doing. This information can be displayed during the engine startup, at runtime and while shutting the engine down. For informational messages, errors, debugging, etc.
The log-subsystem has several log levels:
Error, warning, informational and debug. Note that debug level logging will only be emitted if Suricata was compiled with the --enable-debug configure option.
The first option within the logging configuration is the default-log-level. This option determines the severity/importance level of information that will be displayed. Messages of lower levels than the one set here, will not be shown. The default setting is Info. This means that error, warning and info will be shown and the other levels won't be.
There are more levels: emergency, alert, critical and notice, but those are not used by Suricata yet. This option can be changed in the configuration, but can also be overridden in the command line by the environment variable: SC_LOG_LEVEL .
Default log format
A logging line exists of two parts. First it displays meta information (thread id, date etc.), and finally the actual log message. Example:
(Here the part until the – is the meta info, “This is Suricata 1.0.2” is the actual message.)
It is possible to determine which information will be displayed in this line and (the manner how it will be displayed) in which format it will be displayed.
This option is the so called format string:
The % followed by a character, has a special meaning. There are eight specified signs:
The log-format can be overridden in the command line by the environment variable: SC_LOG_FORMAT
Output-filter
Within logging you can set an output-filter. With this output-filter you can set which part of the event-logs should be displayed. You can supply a regular expression (Regex). A line will be shown if the regex matches.
This value is overridden by the environment var: SC_LOG_OP_FILTER
Outputs
There are different ways of displaying output. The output can appear directly on your screen, it can be placed in a file or via syslog. The last mentioned is an advanced tool for log-management. The tool can be used to direct log-output to different locations (files, other computers etc.)
Packet Acquisition
Pf-ring
The Pf_ring is a library that aims to improve packet capture performance over libcap. It performs packet acquisition.
There are three options within Pf_ring: interface, cluster-id and cluster-type.
Pf_ring will load balance packets based on flow. All packet acquisition threads that will participate in the load balancing need to have the same cluster-id. It is important to make sure this ID is unique for this cluster of threads, so that no other engine / program is making use of clusters with the same id.
Pf_ring can load balance traffic using pf_ring-clusters. All traffic for pf_ring can be load balanced in one of two ways, in a round robin manner or a per flow manner that are part of the same cluster. All traffic for pf_ring will be load balanced across acquisition threads of the same cluster id.
The cluster_round_robin manner is a way of distributing packets one at a time to each thread (like distributing playing cards to fellow players). The cluster_flow manner is a way of distributing all packets of the same flow to the same thread. The flows itself will be distributed to the threads in a round-robin manner.
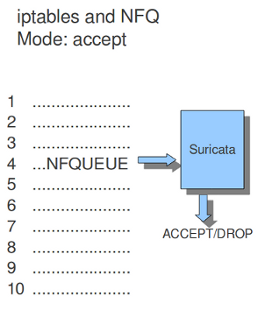
NFQ
Using NFQUEUE in iptables rules, will send packets to Suricata. If the mode is set to 'accept', the packet that has been send to Suricata by a rule using NFQ, will by default not be inspected by the rest of the iptables rules after being processed by Suricata. There are a few more options to NFQ to change this if desired.
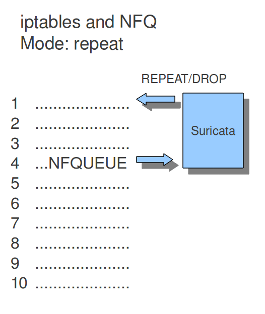
If the mode is set to 'repeat', the packets will be marked by Suricata and be re-injected at the first rule of iptables. To mitigate the packet from being going round in circles, the rule using NFQ will be skipped because of the mark.
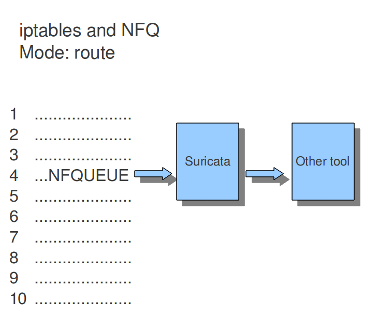
If the mode is set to 'route', you can make sure the packet will be send to another tool after being processed by Suricata. It is possible to assign this tool at the mandatory option 'route_queue'. Every engine/tool is linked to a queue-number. This number you can add to the NFQ rule and to the route_queue option.
Add the numbers of the options repeat_mark and route_queue to the NFQ-rule:
iptables -I FORWARD -m mark ! --mark $MARK/$MASK -j NFQUEUE
*Example 1 NFQ *
mode: accept
Example 2 NFQ
mode: repeat
Example 3 NFQ
mode: route
Ipfw
Suricata does not only support Linux, it supports the FreeBSD operating system (this is an open source Unix operating system) and Mac OS X as well. The in-line mode on FreeBSD uses ipfw (IP-firewall).
Certain rules in ipfw send network-traffic to Suricata. Rules have numbers. In this option you can set the rule to which the network-traffic will be placed back. Make sure this rule comes after the one that sends the traffic to Suricata, otherwise it will go around in circles.
The following tells the engine to re-inject packets back into the ipfw firewall at rule number 5500:
Example 16 Ipfw-reinjection.

Rules
Rule-files
For different categories of risk there are different rule-files available containing one or more rules. There is a possibility to instruct Suricata where to find these rules and which rules you want to be load for use.
You can set the directory where the files can be found.
The above mentioned is an example of rule-files of which can be chosen from. There are much more rule-files available.
If wanted, you can set a full path for a specific rule or rule-file. In that case, the above directory (/etc/suricata/rules/) will be ignored for that specific file. This is convenient in case you write your own rules and want to store them separate from other rules like that of VRT, ET or ET pro.
If you set a file-name that appears to be not existing, Suricata will ignore that entry and display a error-message during the engine startup. It will continue with the startup as usual.
Threshold-file
Within this option, you can state the directory in which the threshold-file will be stored. The default directory is: /etc/suricata/threshold.config
Classifications
The Classification-file is a file which makes the purpose of rules clear.
Some rules are just for providing information. Some of them are to warn you for serious risks like when you are being hacked etc.
In this classification-file, there is a part submitted to the rule to make it possible for the system-administrator to distinguish events.
A rule in this file exists of three parts: the short name, a description and the priority of the rule (in which 1 has the highest priority and 4 the lowest).
You can notice these descriptions returning in the rule and events / alerts.
You can set the direction of the classification configuration.
Rule-vars
There are variables which can be used in rules.
Within rules, there is a possibility to set for which IP-address the rule should be checked and for which IP-address it should not.
This way, only relevant rules will be used. To prevent you from having to set this rule by rule, there is an option in which you can set the relevant IP-address for several rules. This option contains the address group vars that will be passed in a rule. So, after HOME_NET you can enter your home IP-address.
It is a convention to use upper-case characters.
There are two kinds of variables: Address groups and Port-groups. They both have the same function: change the rule so it will be relevant to your needs.
In a rule there is a part assigned to the address and one to the port. Both have their variable.
All options have to be set. If it is not necessary to set a specific address, you should enter 'any'.
Host-os-policy
Operating systems differ in the way they process fragmented packets and streams. Suricata performs differently with anomalies for different operating systems. It is important to set of which operating system your IP-address makes use of, so Suricata knows how to process fragmented packets and streams. For example in stream-reassembly there can be packets with overlapping payloads.
Example 17 Overlapping payloads
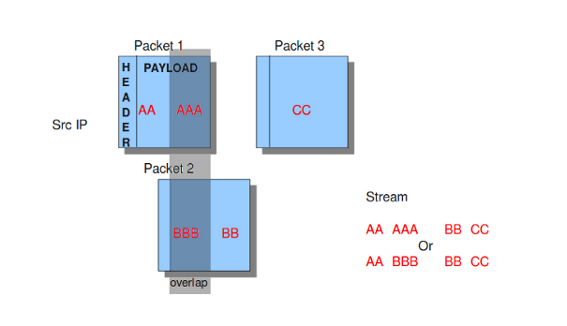
In the configuration-file, the operating-systems are listed. You can add your IP-address behind the name of the operating system you make use of.
Engine analysis and profiling
Suricata offers several ways of analyzing performance of rules and the engine itself.
Engine-analysis
The option engine-analysis provides information for signature writers about how Suricata organises signatures internally.
Like mentioned before, signatures have zero or more patterns on which they can match. Only one of these patterns will be used by the multi pattern matcher (MPM). Suricata determines which patterns will be used unless the fast-pattern rule option is used.
The option engine-analysis creates a new log file in the default log dir. In this file all information about signatures and patterns can be found so signature writers are able to see which pattern is used and change it if desired.
To create this log file, you have to run Suricata with ./src/suricata -c suricata.yaml --engine-analysis.
Example:
Rule and Packet Profiling settings
Rule profiling is a part of Suricata to determine how expensive rules are. Some rules are very expensive while inspecting traffic. Rule profiling is convenient for people trying to track performance problems and resolving them. Also for people writing signatures.
Compiling Suricata with rule-profiling will have an impact on performance, even if the option is disabled in the configuration file.
To observe the rule-performance, there are several options.
This engine is not used by default. It can only be used if Suricata is compiled with:
At the end of each session, Suricata will display the profiling statistics. The list will be displayed sorted.
This order can be changed as pleased. The choice is between ticks, avgticks, checks, maxticks and matches. The setting of your choice will be displayed from high to low.
The amount of time it takes to check the signatures, will be administrated by Suricata. This will be counted in ticks. One tick is one CPU computation. 3 GHz will be 3 billion ticks.
Beside the amount of checks, ticks and matches it will also display the average and the maximum of a rule per session at the end of the line.
The option Limit determines the amount of signatures of which the statistics will be shown, based on the sorting.
Example of how the rule statistics can look like;
Packet Profiling
Packet profiling is enabled by default in suricata.yaml but it will only do its job if you compiled Suricata with --enable profiling.
The filename in which packet profiling information will be stored, is packet-stats.log. Information in this file can be added to the last information that was saved there, or if the append option is set to no, the existing file will be overwritten.
Per packet, you can send the output to a csv-file. This file contains one line for each packet with all profiling information of that packet. This option can be used only if Suricata is build with --enable-profiling and if the packet profiling option is enabled in yaml.
It is best to use runmode 'single' if you would like to profile the speed of the code. When using a single thread, there is no situation in which two threads have to wait for each other . When using two threads, the time threads might have to wait for each other will be taken in account when/during profiling packets.
For more information see Packet Profiling.


 2040
2040


 被折叠的 条评论
为什么被折叠?
被折叠的 条评论
为什么被折叠?
 到【灌水乐园】发言


