


分类和预测是两种常用数据分析方式,可以用于提取数据类模型、预测未来的数据趋势,被广泛用于信用评价、医疗诊断、性能预测和购物选择分析等。本篇文章采用决策树分类模型,利用 sklearn 库提供的决策树分类器对收入数据集进行收入水平分类、预测。
看了本篇博客可以了解:
- Dataframe 结构数据描述性统计分析方法
- sklearn 库决策树分类器构建方法
- 了解分类器性能评价指标及模型调整
本文数据集可以从这里获取:https://archive.ics.uci.edu/ml/machine-learning-databases/adult/adult.data
这是个获取数据的好网站
https://archive.ics.uci.edu/ml/machine-learning-databases
由于读取的是.data数据,列名没有表明,自己定义。
import pandas as pd
names = ("age, workclass, fnlwgt, education, education-num, "
         "marital-status, occupation, relationship, race, sex, "
         "capital-gain, capital-loss, hours-per-week, "
         "native-country, income").split(', ')
data = pd.read_csv('d:/adult.data',names = names)
col_names = data.columns.tolist()data.head()#查看数据形式
data.count()#查看各变量样本数
data.describe()#部分变量描述性统计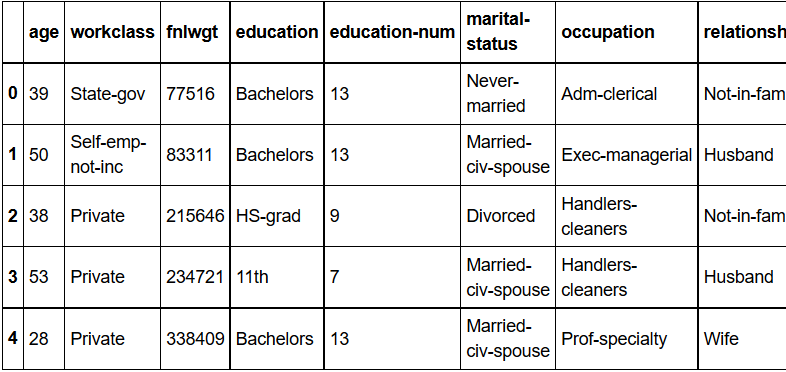
按职业分组、计数并排序:
data.groupby('occupation').size().sort_values(ascending=False)按国籍分组、计数并排序:
data.groupby('native-country').size().sort_values(ascending=False)绘制教育年限直方图:
import matplotlib.pyplot as plt
plt.style.use('ggplot')
data.hist(column='education-num', bins=15);
plt.show()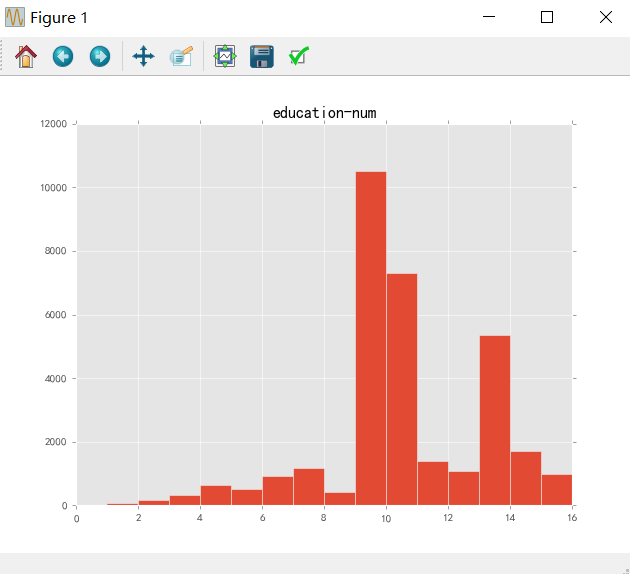
以年龄为横坐标、周平均工作时长为纵坐标绘制散点图:
data.plot(x='age', y='hours-per-week', kind='scatter',
          alpha=0.02, s=50);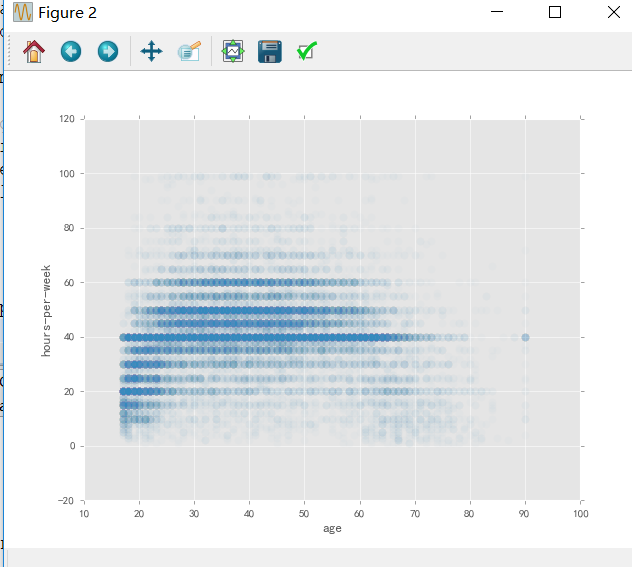
将样本数据按照收入水平分组,并计算各组样本数
得到的结果即收入水平小于等于50K的有24720人,大于50K的有7841人:
data.groupby('income')['income'].count()income
<=50K 24720
>50K 7841
Name: income, dtype: int64data[‘income’] == ’ >50K’中是取值为TRUE(1)或FALSE(0)的布尔值
此处计算其均值,即收入水平大于50K的人数占比:
np.mean(data['income'] == ' >50K')
0.24080955744602439
pandas中Series.unique()返回序列(series)中唯一值的数组(array),目的是检查是否存在缺失值或异常值:
data['income'].unique()
data = data.dropna() # pandas.DataFrame.dropna 可以删除数据框中的缺失值
data['income'].unique() # 如果变量income中含有缺失值,可在此步验证是否已经将缺失值删除
将收入水平不超过50K的数据保存到数据框low_income,高于50K的数据保存到数据框high_income:
low_income = data[data['income'] == ' <=50K']
high_income = data[data['income'] == ' >50K']
绘制、对比不同收入水平的年龄分布情况
bins = np.linspace(10, 90, 20)
plt.hist(low_income['age'].values, bins=bins, alpha=0.5, label='<=50K')
plt.hist(high_income['age'].values, bins=bins, alpha=0.5, label='>50K')
plt.legend(loc='best'); # 添加变量标注说明,参数为位置设置
plt.show()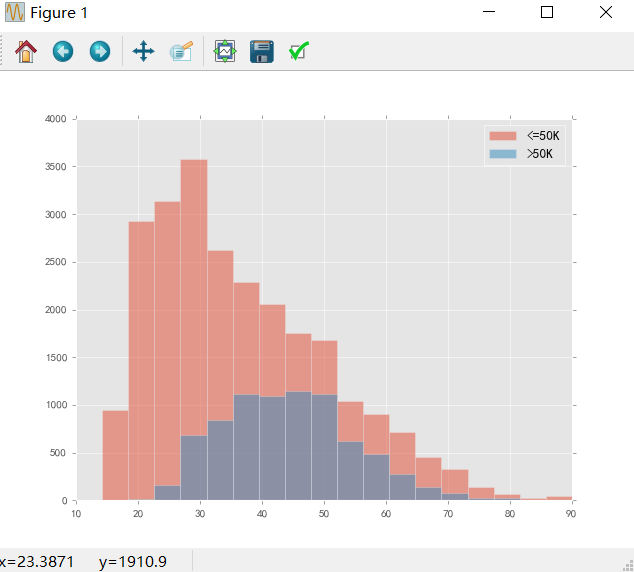
模型构建
设置因变量target(收入income)、自变量features_data(除去income的所有变量):
target = data['income']
features_data = data.drop('income', axis=1)
将数值型变量名称保存到numeric_features列表:
numeric_features = [c for c in features_data if features_data[c].dtype.kind in ('i', 'f')] # 提取数值类型为整数或浮点数的变量
print numeric_features
['age', 'fnlwgt', 'education-num', 'capital-gain', 'capital-loss', 'hours-per-week']将数值型变量值保存到数据框numeric_data:
numeric_data = features_data[numeric_features]
print numeric_data.head(5)
age fnlwgt education-num capital-gain capital-loss hours-per-week
0 39 77516 13 2174 0 40
1 50 83311 13 0 0 13
2 38 215646 9 0 0 40
3 53 234721 7 0 0 40
4 28 338409 13 0 0 40将除去数值型变量的数据,即分类变量数据保存到categorical_data数据框:
categorical_data = features_data.drop(numeric_features, 1)
categorical_data.head(5)
将分类变量转化为数值型表示:
categorical_data_encoded = categorical_data.apply(lambda x: pd.factorize(x)[0]) # pd.factorize即可将分类变量转换为数值表示
                                                                                # apply运算将转换函数应用到每一个变量维度
categorical_data_encoded.head(5)
将处理后的分类变量和数值型变量合并:
features = pd.concat([numeric_data, categorical_data_encoded], axis=1)
features.head()
X = features.values.astype(np.float32) # 转换数据类型
y = (target.values == ' >50K').astype(np.int32) # 收入水平 ">50K" 记为1,“<=50K” 记为0将样本数据随机分成训练集和测试集:
from sklearn.cross_validation import train_test_split # sklearn库中train_test_split函数可实现该划分

X_train, X_test, y_train, y_test = train_test_split(
    X, y, test_size=0.2, random_state=0) # 参数test_size设置训练集占比
利用sklearn库中的DecisionTreeClassifier定义决策树分类器,利用训练集数据进行训练:
from sklearn.tree import DecisionTreeClassifier
from sklearn.cross_validation import cross_val_score

clf = DecisionTreeClassifier(max_depth=8) # 参数max_depth设置树最大深度

# 交叉验证,评价分类器性能,此处选择的评分标准是ROC曲线下的AUC值,对应AUC更大的分类器效果更好
scores = cross_val_score(clf, X_train, y_train, cv=5, scoring='roc_auc')
print("ROC AUC Decision Tree: {:.4f} +/-{:.4f}".format(
    np.mean(scores), np.std(scores)))
待续。。。。。。


 1504
1504


 被折叠的 条评论
为什么被折叠?
被折叠的 条评论
为什么被折叠?
 到【灌水乐园】发言


