dapper 的学习

dapper 大规模分布式跟踪系统

在分布式系统中,一次请求会跨越几个甚至几十个子系统所以我们很难统计出每个系统之间的耗时问题。
所以google研发出dapper , twitter基于dapper研发出zipkin这些大规模耗时跟踪系统。

dapper 如何跟踪系统之间的耗时

下图是分布式系统中最普遍的一次请求,用户发起request请求,A服务接收到,使用rpc调用下面的子系统。
最终形成一颗调用树,所以在需要每次做rpc调用的时候进行时间统计。

dapper的trace

trace

一次完整的跟踪叫做trace,从请求到服务器开始,服务器返回response结束,跟踪每次rpc调用的耗时。

span

在调用rpc服务中,产生一个span用来记录rpc接受到请求的时间,rpc返回请求的时间。
span中下面几个参数

trace_id            用于标示一次完整的请求id
span_id         当前这次调用span_id
parent_id           上层服务的调用span_id      最上层服务parent_id为null
annotations     用于标记的时间戳

span在rpc收到请求创建,在rpc返回响应被收集并且销毁。
在rpc调用时,调用方需要将自己的span信息封装到请求中,被调用方接受到请求,从请求中拿到调用方的trace_id,span_id,生成自己的span。

这样我们可以从收集的时间日志中找到所有的属于trace_id的所有span数据,根据span的parent_id和span_id就能找到自己的完整的调用链,再根据调用链中的annotaion计算出每个服务所消耗的时间

annotation

时间注释,一个span中会有多个annotation注释描述。
在dapper的论文中没有详细描述所需的annotation,在zipkin中,对其的描述是这样。
一次rpc调用中会有四个核心的annotation

server receive   服务器接收      sc
client send         客户端发送       cs
client receive   客户端接收      cr
server send         服务器发送       ss

这个四个核心的annotation记录下一次调用耗时

          调用方rpc                    被调用方rpc

        ------->
                                --------->

                                <---------
        <-------        

          sc                                


          cs                                sr


          cr                                ss


          ss    

    调用方会产生这个四个时间戳,而被调用方因其没有调用其他rpc,所以只有sr和ss两个事件
    span会在sc这个事件中被创建,并且存活于threadlocal中,在ss这个事件中被收集并且被销毁于threadlocal中        
dapper 收集记录

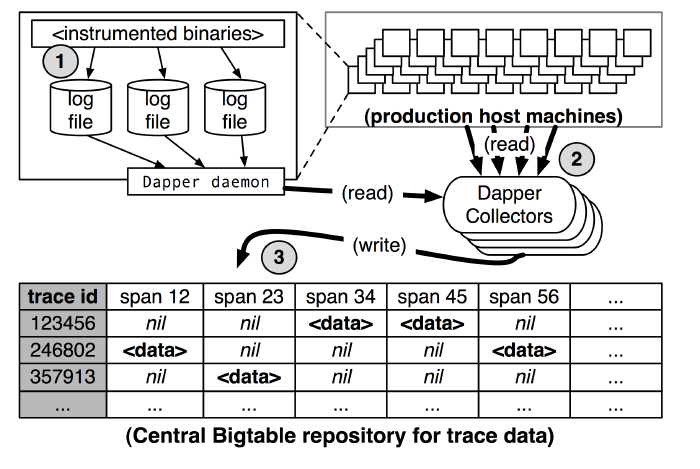
如下图,dapper纪录日志放入log file中,dapper collectors 定时请求拉取日志,存放到bigtable中。
尽管这样,日志量还是太大,dapper采用采样率的方式进行日志采集,采样率为1/1024。
zipkin 对收集工作做的更为复杂,实现了scribe方式,解决任何节点的故障的数据丢失问题。

dapper的trace

关于rpc的改造

dapper没有开源,zipkin的对其dapper的设计进行实现。并且提供java的客户端brave
我们的线上服务使用的dubbo框架,所以只要将brave的api嵌入的dubbo中,并且在rpc调用中将当前的span信息加入到请求中。就可以完成对请求时间日志收集的工作,后端工作zipkin已经实现。

后记

paper传送门:

原文地址:http://static.googleusercontent.com/media/research.google.com/zh-CN//pubs/archive/36356.pdf
译文地址:http://bigbully.github.io/Dapper-translation/

todo:

阅读dubbo源码
阅读brave的demo源码
改造dubbo

Modern Internet services are often implemented as complex, large-scale distributed systems. These applications are constructed from collections of software modules that may be developed by different teams, perhaps in different programming languages, and could span many thousands of machines across multiple physical facilities. Tools that aid in understanding system behavior and reasoning about performance issues are invaluable in such an environment. Here we introduce the design of Dapper, Google’s production distributed systems tracing infrastructure, and describe how our design goals of low overhead, application-level transparency, and ubiquitous deployment on a very large scale system were met. Dapper sharesconceptualsimilaritieswithothertracingsystems, particularlyMagpie[3]andX-Trace[12],butcertaindesign choices were made that have been key to its success in our environment, such as the use of sampling and restricting the instrumentation to a rather small number of common libraries. The main goal of this paper is to report on our experience building, deploying and using the system for over two years, since Dapper’s foremost measure of success has been its usefulness to developer and operations teams. Dapper began as a self-contained tracing tool but evolved into a monitoring platform which has enabled thecreationofmanydifferenttools, someofwhichwere notanticipatedbyitsdesigners. Wedescribeafewofthe analysis tools that have been built using Dapper, share statisticsaboutitsusagewithinGoogle,presentsomeexample use cases, and discuss lessons learned so far.
评论
添加红包

请填写红包祝福语或标题

红包个数最小为10个

红包金额最低5元

当前余额3.43前往充值 >
需支付:10.00
成就一亿技术人!
领取后你会自动成为博主和红包主的粉丝 规则
hope_wisdom
发出的红包
实付
使用余额支付
点击重新获取
扫码支付
钱包余额 0

抵扣说明:

1.余额是钱包充值的虚拟货币,按照1:1的比例进行支付金额的抵扣。
2.余额无法直接购买下载,可以购买VIP、付费专栏及课程。

余额充值