


 本文介绍了iOS开发中使用的Charts框架,分享了如何实现折线图、K线图和柱形图的详细步骤,并探讨了如何通过CombinedChartView实现多种图表的混合显示,为开发者提供实践参考。
近期项目需要使用到K线图、折线图等图表功能,因此接触到了Charts这个框架,不得不说这个图表框架很强大,但是在使用过程中,发现网上很少有关于Charts的功能介绍,而且在GitHub上Charts的介绍也比较简单的介绍,就写写自己的一点心得供大家参考。
首先是最简单的折线图实现,效果如下:
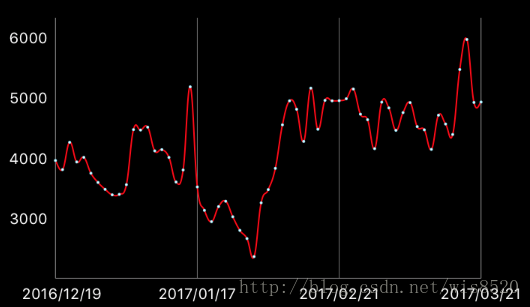
直接上实现代码
    LineChartView *lineChartView = [[LineChartView alloc] init];
    [self.view addSubview:lineChartView];
    self.lineChartView = lineChartView;

    lineChartView.doubleTapToZoomEnabled = NO;//禁止双击缩放 有需要可以设置为YES
    lineChartView.gridBackgroundColor = [UIColor clearColor];//表框以及表内线条的颜色以及隐藏设置 根据自己需要调整
    lineChartView.borderColor = [UIColor clearColor];
    lineChartView.drawGridBackgroundEnabled = NO;
    lineChartView.drawBordersEnabled = NO;
    lineChartView.descriptionText = @"XXX";//该表格的描述名称
    lineChartView.descriptionTextColor = [UIColor whiteColor];//描述字体颜色
    lineChartView.legend.enabled = YES;//是否显示折线的名称以及对应颜色 多条折线时必须开启 否则无法分辨
    lineChartView.legend.textColor = [UIColor whiteColor];//折线名称字体颜色

    //设置动画时间
    [lineChartView animateWithXAxisDuration:1];

    //设置纵轴坐标显示在左边而非右边
    rightAxis = lineChartView.rightAxis;
    rightAxis.drawGridLinesEnabled = NO;

    leftAxis = lineChartView.leftAxis;
    leftAxis.drawGridLinesEnabled = NO;
    leftAxis.labelTextColor = [UIColor whiteColor];

    //设置横轴坐标显示在下方 默认显示是在顶部
    xAxis = lineChartView.xAxis;
    xAxis.labelPosition = XAxisLabelPositionBottom;
    xAxis.labelTextColor = [UIColor whiteColor];
    xAxis.labelCount = 3;
下面是数据方法
  //用于存放多个折线数据的数组
  NSMutableArray *sets = [NSMutableArray array];

  //turnovers是用于存放模型的数组
  self.turnovers = 模型数组 这里是使用的随机生成的模型数据

    //横轴数据
  NSMutableArray *xValues = [NSMutableArray array];
    for (int i = 0; i < self.turnovers.count; i ++) {

        //取出模型数据
        ChartsModel *model = self.turnovers[i];

        [xValues addObject:model.enterDate];
        }

    }
    //设置横轴数据给chartview
    self.lineChartView.xAxis.valueFormatter = [[ChartIndexAxisValueFormatter alloc] initWithValues:xValues];


    //纵轴数据
    NSMutableArray *yValues1 = [NSMutableArray array];
    for (int i = 0; i < self.turnovers.count; i ++) {

        ChartsModel *model = self.turnovers[i];

        ChartDataEntry *entry = [[ChartDataEntry alloc] initWithX:i y:model.amount];
        [yValues1 addObject:entry];
    }

    //创建LineChartDataSet对象
    LineChartDataSet *set1 = [[LineChartDataSet alloc] initWithValues:yValues1 label:@"成交额"];
    set1.circleRadius = 1.0;
    set1.circleHoleRadius = 0.5;
    [set1 setColor:[UIColor redColor]];
    set1.mode = LineChartModeCubicBezier;
    set1.drawValuesEnabled = NO;

    //sets内存放所有折线的数据 多个折线创建多个LineChartDataSet对象即可
    [sets addObject:set1];

    LineChartData *data = [[LineChartData alloc] initWithDataSets:sets];

    self.lineChartView
最低0.47元/天 解锁文章


 7818
7818

 被折叠的 条评论
为什么被折叠?
被折叠的 条评论
为什么被折叠?
 到【灌水乐园】发言


