


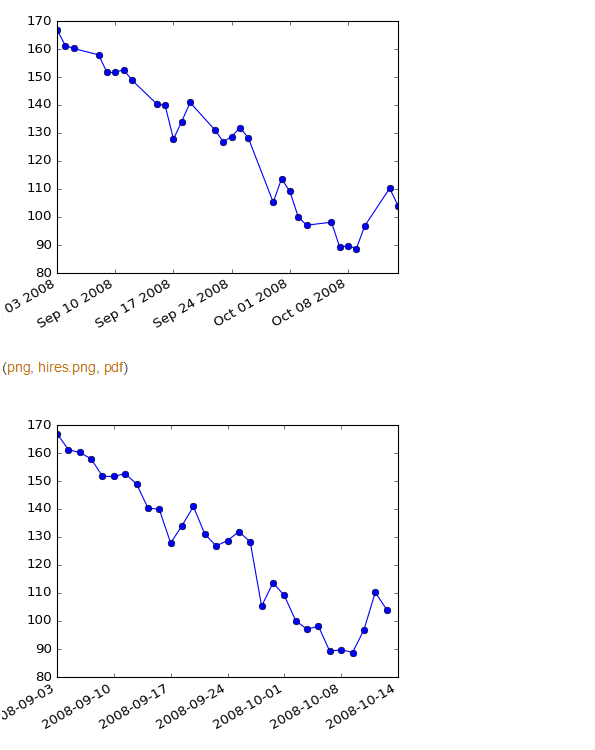
可以看到:日期格式有了变化?在matplotlib中,py的实现代码如下,但是Julia如何实现?
http://matplotlib.org/examples/api/date_index_formatter.html
from __future__ import print_function
import numpy as np
import matplotlib.pyplot as plt
import matplotlib.mlab as mlab
import matplotlib.cbook as cbook
import matplotlib.ticker as ticker

datafile = cbook.get_sample_data('aapl.csv', asfileobj=False)
print('loading %s' % datafile)
r = mlab.csv2rec(datafile)

r.sort()
r = r[-30:]  # get the last 30 days


# first we'll do it the default way, with gaps on weekends
fig, ax = plt.subplots()
ax.plot(r.date, r.adj_close, 'o-')
fig.autofmt_xdate()

# next we'll write a custom formatter
N = len(r)
ind = np.arange(N)  # the evenly spaced plot indices


def format_date(x, pos=None):
    thisind = np.clip(int(x + 0.5), 0, N - 1)
    return r.date[thisind].strftime('%Y-%m-%d')

fig, ax = plt.subplots()
ax.plot(ind, r.adj_close, 'o-')
ax.xaxis.set_major_formatter(ticker.FuncFormatter(format_date))
fig.autofmt_xdate()

plt.show()
Julia的代码难点在哪里?
using PyPlot;
clf();
close();
fig =figure();
ax = fig[:add_subplot](111)  # 或 fig, ax = PyPlot.subplots()
x = [Date(now()) + Dates.Day(i) for i in collect(1:100)] # 日期图
y = rand(100)
ax[:plot](x,y, color="red", linewidth=2.0, linestyle="-")

fig[:autofmt_xdate]()# x轴的日期是默认格式安排
要变成其它的日期格式(2016-05-06)那需要如何处理?
ax.xaxis.set_major_formatter(ticker.FuncFormatter(format_date))=>???????
ax[:xaxis][:set_major_formatter]


 1万+
1万+


 被折叠的 条评论
为什么被折叠?
被折叠的 条评论
为什么被折叠?
 到【灌水乐园】发言


