


在.net开发中一般都会使用到图形统计的功能,highcharts是个不错的选择。
其官网地址:http://www.hcharts.cn/
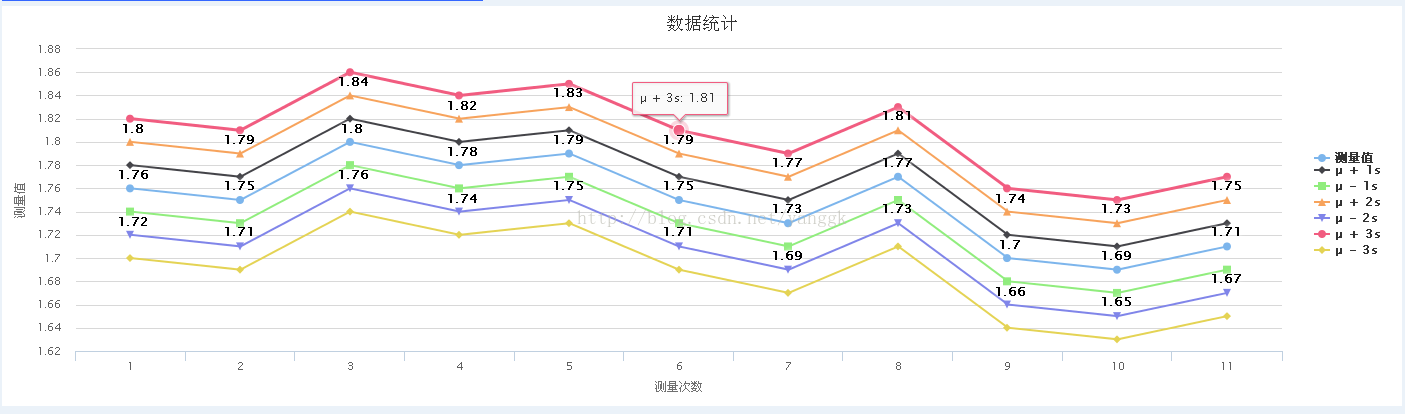
效果图:
引用js文件:
<script src="http://cdn.hcharts.cn/jquery/jquery-1.8.3.min.js"></script>
<script src="http://cdn.hcharts.cn/highcharts/highcharts.js"></script>
这里直接引用了官网的js文件,使用的时候可以去下载下来。
<script type="text/javascript">
var chart;
$(document).ready(function() {
chart = new Highcharts.Chart({
chart: {
renderTo: 'container',
defaultSeriesType: 'line',
marginRight:120,
reflow:false
},
title: {
text: <%= strTitle %> //标题 没有数据的时候就不显示了
},
xAxis: {
categories: <%= xAxisCategories %>, //x轴坐标
tickPixelInterval:0.2,
title: {
text: '测量次数'
}
},
yAxis: {
title: {
text: '测量值'
},
tickPixelInterval:20, //设置y轴刻度
max:<%= Ymax %>, // 定义Y轴 最大值
min:<%= Ymin %> // 定义最小值
},
tooltip: {
formatter: function() {
return ''+ this.series.name +': '+ this.y;
}
},
plotOptions: {
line: {
dataLabels: {
enabled: true
},
enableMouseTracking: true
}
},
legend: {
layout: 'vertical',//horizontal 水平显示
align: 'right',
verticalAlign: 'middle',
borderWidth: 0
},
credits: {
enabled: false
},
exporting:{
enabled: false //不显示下载和打印功能
},
series: <%= returnValue %>
});
});
</script>
html中
<div id="container" style="MIN-WIDTH: 800px; MARGIN-TOP: 5px; HEIGHT: 400px"><FONT face="宋体"></FONT></div>
cs文件
public string returnValue = "";
public string xAxisCategories = "";
public string strTitle ="";
public str
 最低0.47元/天 解锁文章


 4026
4026


 被折叠的 条评论
为什么被折叠?
被折叠的 条评论
为什么被折叠?
 到【灌水乐园】发言


