


通过Spring Cloud Sleuth (1)-入门篇我们已经引入了Sleuth的基础模块完成一次任务链的跟踪,但是由于日志文件都离散的存储在各个微服务结点上,日常运维时仅仅通过查看日志文件来分析定位问题还是一件繁琐的问题。所以我们需要一些工具来收集、存储、分析和展示日志信息,例如ELK(ElasticSearch、Logstash、kibana)组件。
Spring Cloud Sleuth与ELK整合时实际上只要与Logstash对接既可,所以我们要为Logstash准备好Json格式的日志信息。SpringBoot默认使用logback来记录日志,而Logstash自身也有对logback日志工具的支持工具,所以可以直接通过在logback配置中增加Logstash的Appender来非常方便的将日志转化为Json的格式存储和输出了。
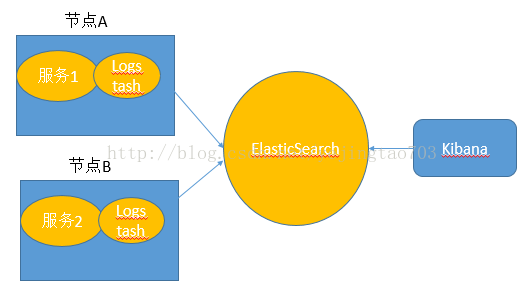
Spring Cloud Sleuth与Logstash的直接集成有两种方式:
Logstash与微服务应用安装在一起,监听日志文件
之所以上面用了直接这个词,因为还存在间接形式的变种,微服务将日志发送给Redis或者MQ,再由他们去对接Logstash。
实例代码:
Eureka-Server:https://github.com/yejingtao/forblog/tree/master/demo-eureka-register
ELK-Trace1:https://github.com/yejingtao/forblog/tree/master/demo-elk-trace1
ELK-Trace2:https://github.com/yejingtao/forblog/tree/master/demo-elk-trace2
先看如何实现日志的Json格式化:
<dependency>
            <groupId>net.logstash.logback</groupId>
            <artifactId>logstash-logback-encoder</artifactId>
            <version>4.6</version>
</dependency>/resources下个配置文件
application.yml:spring boot的配置信息
logback-spring.xml:logstash集成的配置信息,在我的项目中项目跟目录下和/src/main/resources下各有一个logback-spring.xml文件,分别代表两种部署方式。
bootstrap.properties:里面只有一行配置,是logback-spring.xml中需要到的参数,由于logback-spring.xml的加载在application.yml之前,所以讲spring.application.name的配置信息定义在最先加载的bootstrap.properties文件中。
剩下的代码参考Spring Cloud Sleuth (1)-入门篇没有任何改造。
<?xml version="1.0" encoding="UTF-8"?>
<!--该日志将日志级别不同的log信息保存到不同的文件中 -->
<configuration>
	<include resource="org/springframework/boot/logging/logback/defaults.xml" />

	<springProperty scope="context" name="springAppName"
		source="spring.application.name" />

	<!-- 日志在工程中的输出位置 -->
	<property name="LOG_FILE" value="${BUILD_FOLDER:-build}/${springAppName}" />

	<!-- 控制台的日志输出样式 -->
	<property name="CONSOLE_LOG_PATTERN"
		value="%clr(%d{yyyy-MM-dd HH:mm:ss.SSS}){faint} %clr(${LOG_LEVEL_PATTERN:-%5p}) %clr(${PID:- }){magenta} %clr(---){faint} %clr([%15.15t]){faint} %m%n${LOG_EXCEPTION_CONVERSION_WORD:-%wEx}}" />

	<!-- 控制台输出 -->
	<appender name="console" class="ch.qos.logback.core.ConsoleAppender">
		<filter class="ch.qos.logback.classic.filter.ThresholdFilter">
			<level>INFO</level>
		</filter>
		<!-- 日志输出编码 -->
		<encoder>
			<pattern>${CONSOLE_LOG_PATTERN}</pattern>
			<charset>utf8</charset>
		</encoder>
	</appender>

	<!-- 为logstash输出的JSON格式的Appender -->
	<appender name="logstash"
		class="ch.qos.logback.core.rolling.RollingFileAppender">
		<file>${LOG_FILE}.json</file>
		<rollingPolicy class="ch.qos.logback.core.rolling.TimeBasedRollingPolicy">
			<!--日志文件输出的文件名 -->
			<fileNamePattern>${LOG_FILE}.json.%d{yyyy-MM-dd}.gz</fileNamePattern>
			<!--日志文件保留天数 -->
			<MaxHistory>3</MaxHistory>
		</rollingPolicy>
		<!-- 日志输出编码 -->
		<encoder
			class="net.logstash.logback.encoder.LoggingEventCompositeJsonEncoder">
			<providers>
				<timestamp>
					<timeZone>UTC</timeZone>
				</timestamp>
				<pattern>
					<pattern>
						{
						"severity": "%level",
						"service": "${springAppName:-}",
						"trace": "%X{X-B3-TraceId:-}",
						"span": "%X{X-B3-SpanId:-}",
						"exportable": "%X{X-Span-Export:-}",
						"pid": "${PID:-}",
						"thread": "%thread",
						"class": "%logger{40}",
						"rest": "%message"
						}
					</pattern>
				</pattern>
			</providers>
		</encoder>
	</appender>

	<!-- 日志输出级别 -->
	<root level="INFO">
		<appender-ref ref="console" />
		<appender-ref ref="logstash" />
	</root>
</configuration>先启动eureka,再启动elk-trace1和elk-trace2,浏览器访问http://localhost:7081/trace1验证结果。
{"@timestamp":"2017-10-19T15:27:48.353+00:00","severity":"INFO","service":"elk-trace1","trace":"a4ffc6b012f6ae8e","span":"a4ffc6b012f6ae8e","exportable":"false","pid":"8756","thread":"http-nio-7081-exec-10","class":"c.y.trace1.controller.Trace1Controller","rest":"======<call trace 1>======="}现在已经有了Json日志数据,那么如何将这些数据送给Logstash呢?
按照前面2种方案设计,先看微服务与Logstash部署在一起的监听日志文件的方式。
# For detail structure of this file
# Set: https://www.elastic.co/guide/en/logstash/current/configuration-file-structure.html
input {
  # For detail config for log4j as input,
  # See: https://www.elastic.co/guide/en/logstash/current/plugins-inputs-log4j.html
  file {
    type => "server"
    path => "C:\spring\workspace\demo-elk-trace1\build\elk-trace1.json"
  }
}
filter {
  #Only matched data are send to output.
}
output {
  # For detail config for elasticsearch as output,
  # See: https://www.elastic.co/guide/en/logstash/current/plugins-outputs-elasticsearch.html
  elasticsearch {
    action => "index"          #The operation on ES
    hosts  => "192.168.226.133:9200"   #ElasticSearch host, can be array.
    index  => "applog"         #The index to write data to.
  }
}
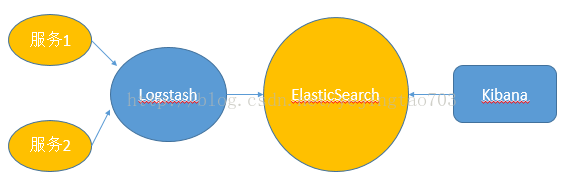
再看第二种方案,独立部署Logstash:
在一个空闲的逻辑节点上安装Logstash,配置文件如下:
# For detail structure of this file
# Set: https://www.elastic.co/guide/en/logstash/current/configuration-file-structure.html
input {
  # For detail config for log4j as input,
  # See: https://www.elastic.co/guide/en/logstash/current/plugins-inputs-log4j.html
  tcp {
    mode => "server"
    host => "192.168.226.133"
    port => 9250
  }
}
filter {
  #Only matched data are send to output.
}
output {
  # For detail config for elasticsearch as output,
  # See: https://www.elastic.co/guide/en/logstash/current/plugins-outputs-elasticsearch.html
  elasticsearch {
    action => "index"          #The operation on ES
    hosts  => "192.168.226.133:9200"   #ElasticSearch host, can be array.
    index  => "applog"         #The index to write data to.
  }
}
监听192.168.226.133:4567地址,将接收到的消息内容转发给elasticSearch接收地址。
代码需要做下改造,因为目前的代码只是将log日志信息的记录方式改为了Json格式,还不具备向Logstash的推送功能,修改logback-spring.xml,使用src/main/resources中的:
<?xml version="1.0" encoding="UTF-8"?>
<!--该日志将日志级别不同的log信息保存到不同的文件中 -->
<configuration>
	<include resource="org/springframework/boot/logging/logback/defaults.xml" />

	<springProperty scope="context" name="springAppName"
		source="spring.application.name" />

	<!-- 日志在工程中的输出位置 -->
	<property name="LOG_FILE" value="${BUILD_FOLDER:-build}/${springAppName}" />

	<!-- 控制台的日志输出样式 -->
	<property name="CONSOLE_LOG_PATTERN"
		value="%clr(%d{yyyy-MM-dd HH:mm:ss.SSS}){faint} %clr(${LOG_LEVEL_PATTERN:-%5p}) %clr(${PID:- }){magenta} %clr(---){faint} %clr([%15.15t]){faint} %m%n${LOG_EXCEPTION_CONVERSION_WORD:-%wEx}}" />

	<!-- 控制台输出 -->
	<appender name="console" class="ch.qos.logback.core.ConsoleAppender">
		<filter class="ch.qos.logback.classic.filter.ThresholdFilter">
			<level>INFO</level>
		</filter>
		<!-- 日志输出编码 -->
		<encoder>
			<pattern>${CONSOLE_LOG_PATTERN}</pattern>
			<charset>utf8</charset>
		</encoder>
	</appender>

	<!-- 为logstash输出的JSON格式的Appender -->
	<appender name="logstash"
		class="net.logstash.logback.appender.LogstashTcpSocketAppender">
		<destination>192.168.226.133:9250</destination>
		<!-- 日志输出编码 -->
		<encoder
			class="net.logstash.logback.encoder.LoggingEventCompositeJsonEncoder">
			<providers>
				<timestamp>
					<timeZone>UTC</timeZone>
				</timestamp>
				<pattern>
					<pattern>
						{
						"severity": "%level",
						"service": "${springAppName:-}",
						"trace": "%X{X-B3-TraceId:-}",
						"span": "%X{X-B3-SpanId:-}",
						"exportable": "%X{X-Span-Export:-}",
						"pid": "${PID:-}",
						"thread": "%thread",
						"class": "%logger{40}",
						"rest": "%message"
						}
					</pattern>
				</pattern>
			</providers>
		</encoder>
	</appender>

	<!-- 日志输出级别 -->
	<root level="INFO">
		<appender-ref ref="console" />
		<appender-ref ref="logstash" />
	</root>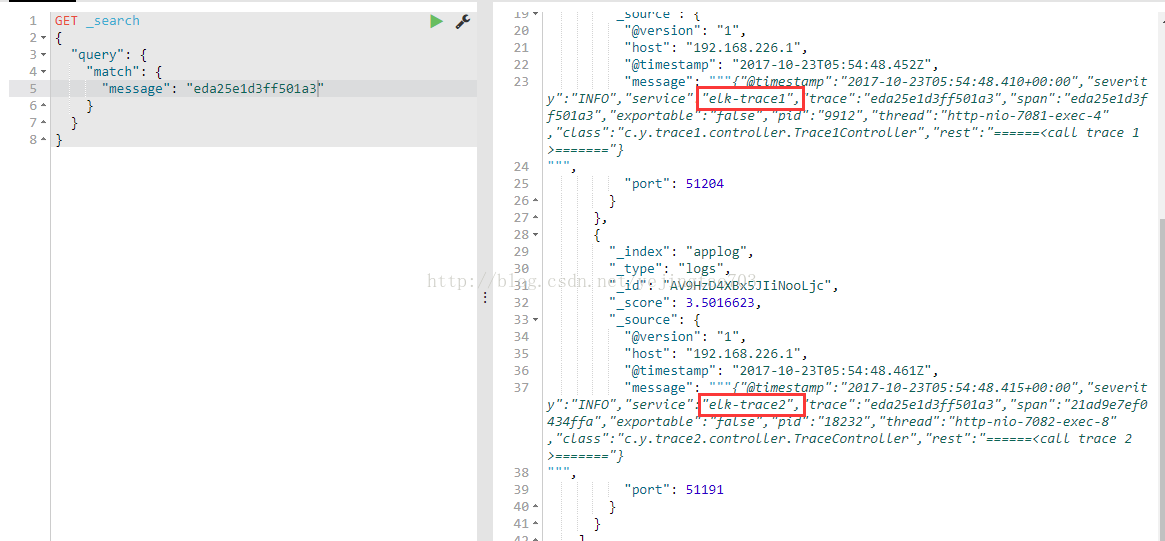
</configuration>浏览器请求http://localhost:7081/trace1
任务链请求到trace1,trace1调用到trace2的服务,整个任务链的日志信息都经过logstash收集发送给了elasticsearch,搜索es可以获得本次任务链的所有节点的日志信息:


 361
361


 被折叠的 条评论
为什么被折叠?
被折叠的 条评论
为什么被折叠?
 到【灌水乐园】发言


