


后台所用技术springmvc+ibatis
实现效果
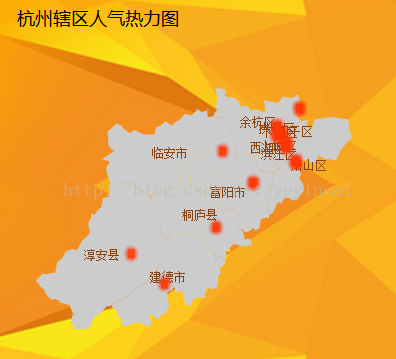
代码实现如下
<!DOCTYPE html>
<html lang="en">
<head>
    <meta charset="UTF-8">
    <meta name="viewport" content="width=device-width, initial-scale=1.0">
    <script src="${rc.contextPath}/common/js/jquery-1.10.2.js"></script>
    <script src="${rc.contextPath}/common/plugs/echart/js/esl.js" type="text/javascript"></script>
</head>

<body>

<div id="main" style="width:100%;height:350px;">  </div>

</body>


<script type="text/javascript">

	require.config({
		paths:{
		 'echarts': '${rc.contextPath}/common/plugs/echart/js/echarts-map'
		}
	});

	// 作为入口
	require(
    [
        'echarts',
		 'echarts/chart/map'
    ],
    function (ec) {
    	var myChart = ec.init(document.getElementById('main'));

        var cityMap = {
		    "杭州市": "330100"
		};
		var placeList = [
			{name:'西湖区', geoCoord:[120.13, 30.27],count:$!{xh}},
			{name:'上城区', geoCoord:[120.17, 30.25],count:$!{sc}},
			{name:'下城区', geoCoord:[120.17, 30.28],count:$!{xc}},
			{name:'江干区', geoCoord:[120.20, 30.27],count:$!{jg}},
			{name:'拱墅区', geoCoord:[120.13, 30.32],count:$!{gs}},
			{name:'滨江区', geoCoord:[120.20, 30.20],count:$!{bj}},
			{name:'萧山区', geoCoord:[120.27, 30.17],count:$!{xs}},
			{name:'余杭区', geoCoord:[120.30, 30.42],count:$!{yh}},
			{name:'桐庐县', geoCoord:[119.67, 29.80],count:$!{tl}},
			{name:'淳安县', geoCoord:[119.03, 29.60],count:$!{ca}},
			{name:'建德市', geoCoord:[119.28, 29.48],count:$!{jd}},
			{name:'富阳市', geoCoord:[119.95, 30.05],count:$!{fy}},
			{name:'临安市', geoCoord:[119.72, 30.23],count:$!{la}}
		];
        option = {
		    tooltip : {
		        trigger: 'item',
		        formatter: '{b}'
		    },

		    series : [
		        {
		            name: '杭州市地图',
		            type: 'map',
		            mapType: '杭州市',
		            roam:true,
		            itemStyle:{
		                normal:{label:{show:true}},
		                emphasis:{label:{show:true}}
		            },
		            data:[],
					markPoint : {
						symbol:'Circle',
		                symbolSize: 0.3,
		                large: true,
		                effect : {
		                    show: true
		                },
						itemStyle:{
						  normal:{color:"#FF3300"}
						},
		                data : (function(){
		                	var data = [];
		                	for(var j=0;j<placeList.length;j++){

		                    	var len = placeList[j].count;
								var x = parseInt(4*Math.random())%4;
		                    	var geoCoord = placeList[j].geoCoord;
		                    	while(len--) {
									if(x==0){
										data.push({
											name : placeList[j].name + len,
											value : 2000,
											geoCoord : [
												geoCoord[0] + Math.random()*0.05,
												geoCoord[1] + Math.random()*0.05
											]
										})
									}
									if(x==1){
										data.push({
											name : placeList[j].name + len,
											value : 2000,
											geoCoord : [
												geoCoord[0] + Math.random()*0.05,
												geoCoord[1] - Math.random()*0.05
											]
										})
									}
									if(x==2){
										data.push({
											name : placeList[j].name + len,
											value : 2000,
											geoCoord : [
												geoCoord[0] - Math.random()*0.05,
												geoCoord[1] - Math.random()*0.05
											]
										})
									}
									if(x==3){
										data.push({
											name : placeList[j].name + len,
											value : 2000,
											geoCoord : [
												geoCoord[0] + Math.random()*0.05,
												geoCoord[1] - Math.random()*0.05
											]
										})
									}
		                    	}
		                    }

		                    return data;
		                })()
		            }
		        }
		    ],
		    backgroundColor: '#fffff'
        };
        var curIndx = 0;
		var mapType = [];
		var mapGeoData = require('echarts/util/mapData/params');

		for (var city in cityMap) {
		    mapType.push(city);
		    // 自定义扩展图表类型
		    mapGeoData.params[city] = {
		        getGeoJson: (function (c) {
		            var geoJsonName = cityMap[c];
		            return function (callback) {
		                $.getJSON('${rc.contextPath}/common/plugs/echart/js/' + geoJsonName + '.json', callback);
		            }
		        })(city)
		    }
		}

		var ecConfig = require('echarts/config');
		var zrEvent = require('zrender/tool/event');


        myChart.setOption(option);
    }
);
</script>

</html>
前台所需要的js,前往


 257
257


 被折叠的 条评论
为什么被折叠?
被折叠的 条评论
为什么被折叠?
 到【灌水乐园】发言


