


搜索图像二值化方法中的阈值法,有以下这些:
挑选其中的一部分学习。
一、基于点的全局阈值法
1. 直方图双峰法(需要有明显的谷底)
2. 最大类间方差法(目标与背景的大小之比很小时失效)
3. 熵方法
4. 最小误差阈值
5. 矩量保持法
6. 模糊集方法
二、基于区域的全局阈值方法
1. 二维熵阈值分割方法
2. 简单统计法
3. 直方图变化法
4. 松弛法
三、局部阈值方法和多阈值法
1. 局部阈值(动态阈值)
2. 阈值差值法
3. 水线阈值法
4. 基于小波的多阈值方法
5. 基于边界点的递归多阈值方法
6. 均衡对比度递归多阈值方法
1.1 直方图双峰法
说明:该方法适用于直方图有两个峰的图像,如果直方图曲线平坦或者只有一个峰的图像不适合。
实现方法参考 http://www.cnblogs.com/Imageshop/p/3307308.html
步骤:a. 颜色空间从RGB转到HSV,计算V通道直方图。
b.直方图平滑。计算方法是(i-1),i, (i+1) 三个数计算平均值作为第i个数的新值,迭代1000次,如果1000次后还是没有得到双峰说明迭代失败不适合用双峰法二值化。
c.得到双峰图后,计算谷底作为阈值。
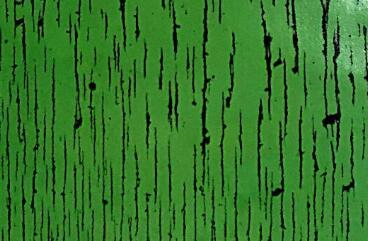
测试图如下。背景颜色单一,前景颜色单一,背景与前景颜色差别较大。
代码:
hist_T.h 类的声明
//------------直方图阈值分割----------
//基于直方图的多种阈值分割算法

#include <opencv2\opencv.hpp>
#include <opencv2\highgui\highgui.hpp>
#include <opencv2\imgproc\imgproc.hpp>
#include <opencv2\core\core.hpp>
#include <iostream>
#include <stdio.h>

using namespace std;
using namespace cv;

class hist_T
{
public:
	hist_T();
	Mat hist_calculation(Mat in);         //输出hist
	Mat drawHist(Mat _hist, string f);    //输出画好的直方图histImg
	void setFilename(string f);           //传入图像名
	int GetMinThreshold(Mat _hist);       //把直方图平滑为双峰直方图,求谷底灰度级
	Mat inputImg;        //输入原始图像
	string filename;     //图像名
	Mat filter_hist;     //滤波后的直方图
	//Mat histImg;         //画出的直方图曲线用来显示
	bool showStep;
	bool saveImage;
private:
	bool IsDimodal(Mat _hist);      //判断直方图是否为双峰

};//---------基于直方图的阈值分割------
#include "hist_T.h"
hist_T::hist_T() {
showStep = false;
saveImage = false;
}
void hist_T::setFilename(string s) {
filename=s;
}
//--计算直方图--
//输入单通道图像,输出统计直方图hist
Mat hist_T::hist_calculation(Mat in)
{
//output
Mat hist;
if(in.channels()==3) {
cvtColor(in, in, CV_BGR2GRAY);
}
//Establish the number of bins
int histSize = 256;
//Set the range
float range[] = {0, 256};
const float* histRange = {range};
bool uniform = true; bool accumulate = false;
calcHist(&in,
1, //the number of source arrays
0, //the channel(dim) to be measured
Mat(), //A mask to be used on the source array
hist, //The Mat object where the historgam will be stored (float型)
1, //The histogram dimensionality
&histSize, //The number of bins per each used dimension
&histRange, //The range of values to be measured per each dimension
uniform, //Bins have the same size;
accumulate); //clear the histograms in the beginning
//cout<<_hist.rows<<"\t"<<_hist.cols<<"\t"<<_hist.channels()<<endl; //256*1*1
return hist;
}
//---draw the historgram
Mat hist_T::drawHist(Mat _hist, string s)
{
int hist_w = 512; //显示直方图的宽cols
int hist_h = 400; //显示直方图的高rows
int histSize = 256; //Establish the number of bins
int bin_w = cvRound( (double) hist_w/histSize ); //每一个bin占多少个灰度级(这里=2)
//cout<<"bin_w="<<bin_w<<endl;
Mat _histImage = Mat::zeros(hist_h, hist_w, CV_8UC3);
//normalize the result to [0, histImage.rows] 直方图的高度0~400
normalize(_hist, _hist, 0, _histImage.rows, NORM_MINMAX, -1, Mat() );
//draw
for(int i=1; i<histSize; ++i)
{
line(_histImage, Point(bin_w*(i-1), hist_h - cvRound(_hist.at<float>(i-1)) ),
Point(bin_w*(i), hist_h - cvRound(_hist.at<float>(i)) ),
Scalar(0,0,255), 1, 8, 0 );
}
//show histImg
if(showStep)
imshow("histImage", _histImage);
if(saveImage)
imwrite(s, _histImage);
return _histImage;
}
//平滑直方图,得到双峰直方图,求出谷底灰度级作为阈值
int hist_T::GetMinThreshold(Mat _hist) {
int Iter = 0;
//复制两份数据,求均值的时候会破坏输入的数,由histC计算得到histCC
Mat histC = _hist.clone();
Mat histCC = _hist.clone();
//histC.convertTo(histC, CV_32F); //如果有必要,转换数据类型,CV_8U 不能直接用来计算
//通过三点求均值来平滑直方图
while(IsDimodal(histCC) == false) //判断是否已经是双峰图像
{
histCC.at<float>(0) = ( histC.at<float>(0) + histC.at<float>(0) + histC.at<float>(1) )/3; //第一点
for(int i=1; i<255; ++i)
histCC.at<float>(i) = ( histC.at<float>(i-1) + histC.at<float>(i) + histC.at<float>(i+1) )/3; //中间的点
histCC.at<float>(255) = ( histC.at<float>(254) + histC.at<float>(255) + histC.at<float>(255) )/3; //最后的点
//复制
histCC.copyTo(histC);
//迭代1000次还没有得到双峰则迭代失败
Iter++;
if(Iter >= 1000)
return -1;
}
//filter_hist是类中的一个数据成员,现在把histCC的值传给它保存下来后面要用到
filter_hist = histCC;
//阈值为双峰的谷底(检测到第一个峰,之后找谷)
bool peakFound = false;
for(int i=1; i<255; ++i)
{
if(histCC.at<float>(i-1) < histCC.at<float>(i) && histCC.at<float>(i+1) < histCC.at<float>(i) )
peakFound = true;
if(peakFound = true && histCC.at<float>(i-1) > histCC.at<float>(i) && histCC.at<float>(i+1) > histCC.at<float>(i))
return i-1; //为什么不是返回i?
}
return -1; //为什么要返回-1?
}
bool hist_T::IsDimodal(Mat _hist)
{
//对直方图的峰进行统计,峰数为2为双峰
int cnt = 0;
for(int i=1; i<255; ++i)
{
if(_hist.at<float>(i-1) < _hist.at<float>(i) && _hist.at<float>(i+1) < _hist.at<float>(i))
{
cnt++;
if(cnt>2)
return false;
}
}
if(cnt == 2)
return true;
else
return false;
}//---------基于直方图的阈值分割------
//基于直方图的多种阈值分割算法
#include <opencv2\opencv.hpp>
#include <opencv2\highgui\highgui.hpp>
#include <opencv2\imgproc\imgproc.hpp>
#include <opencv2\core\core.hpp>
#include <iostream>
#include <stdio.h>
#include "hist_T.h"
using namespace cv;
using namespace std;
int main()
{
//load image
Mat src = imread("1.bmp", 1);
Mat img1 = src.clone(); //避免处理过程中对原图的修改
if( !src.data )
{ return -1;}
//颜色空间转换
cvtColor(img1, img1, CV_BGR2HSV);
//cvtColor(img1, img1, CV_BGR2GRAY);
//Separate the image in 3 places()
vector<Mat> hsv_planes;
split( img1, hsv_planes);
imwrite("hsv_H.bmp", hsv_planes[0]);
imwrite("hsv_S.bmp", hsv_planes[1]);
imwrite("hsv_V.bmp", hsv_planes[2]);
//求统计直方图(hist)并保存直方图曲线(histImg)
hist_T hist_t;
hist_t.showStep = true;
hist_t.saveImage = true;
Mat hist_H, hist_S, hist_V; //统计直方图
Mat histImg_H, histImg_S, histImg_V; //用于显示的直方图曲线图
string sn1 = "D:/vc2010-project/allThreshold/savedImg/histImg_H.bmp";
string sn2 = "D:/vc2010-project/allThreshold/savedImg/histImg_S.bmp";
string sn3 = "D:/vc2010-project/allThreshold/savedImg/histImg_V.bmp";
hist_H = hist_t.hist_calculation(hsv_planes[0]);
hist_S = hist_t.hist_calculation(hsv_planes[1]);
hist_V = hist_t.hist_calculation(hsv_planes[2]);
histImg_H = hist_t.drawHist(hist_H, sn1);
histImg_S = hist_t.drawHist(hist_S, sn2);
histImg_V = hist_t.drawHist(hist_V, sn3); //V通道直方图
//发现hist_V的直方图相对较好
//平滑直方图,得到双峰直方图,求出谷底灰度级作为阈值
int minTh;
minTh = hist_t.GetMinThreshold(hist_V);
cout<<"minTh="<<minTh<<endl; //minTh = 66
Mat f_hist = hist_t.filter_hist; //只有当执行完GetMinThreshold()函数的时候才会得到hist_t.filter_hist
//cout<<f_hist.rows<<"\t"<<f_hist.cols<<"\t"<<f_hist.channels()<<endl; //测试f_hist是否为空
string sn4 = "D:/vc2010-project/allThreshold/savedImg/histImg_V_filter.bmp";
Mat histImg_V_filter = hist_t.drawHist(f_hist, sn4);
//二值化
Mat bit_H = Mat::zeros(img1.size(), CV_8UC1); // H通道二值化
threshold(hsv_planes[2], bit_H, minTh, 255, CV_THRESH_BINARY);
string sn5 = "D:/vc2010-project/allThreshold/savedImg/bit_H.bmp";
imwrite(sn5, bit_H);
for(;;)
{
int c;
c = cvWaitKey(10);
if( (char) c == 27)
break;
}
return 0;
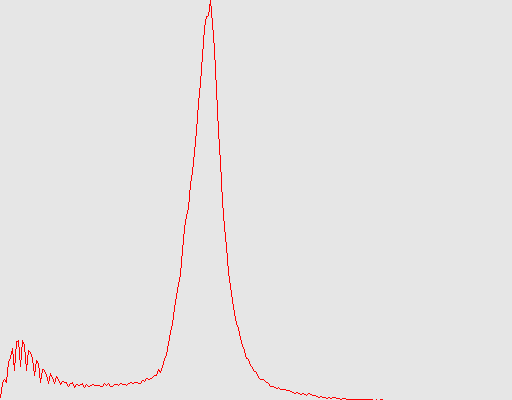
}1.先看下H、S、V三通道的灰度图及对应的直方图
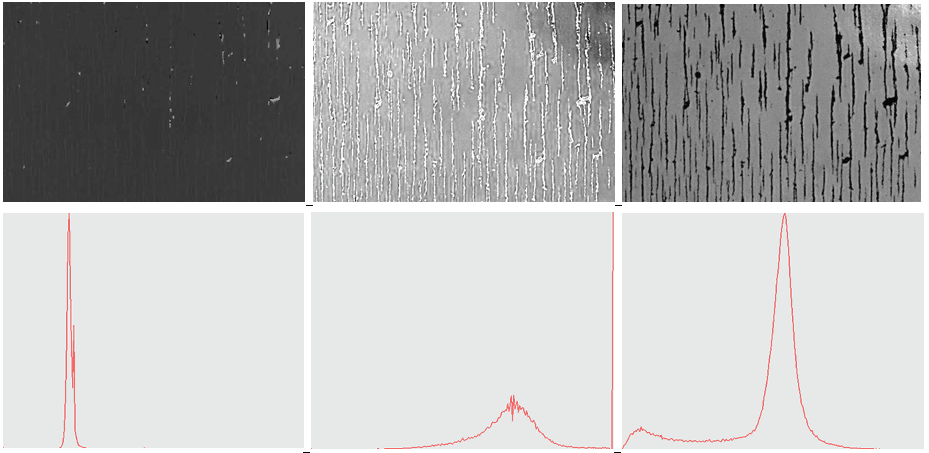
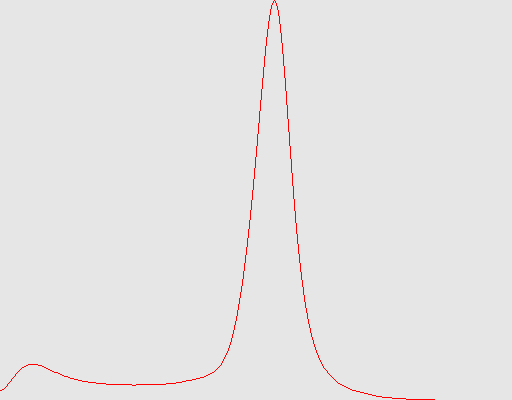
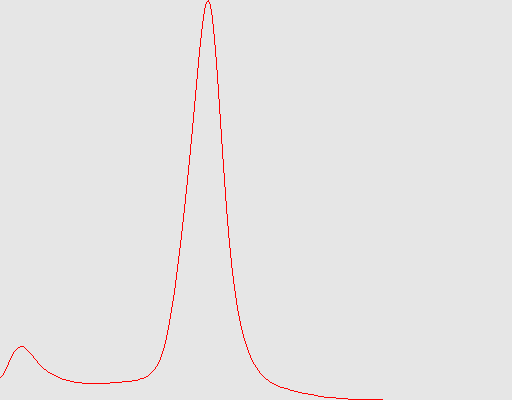
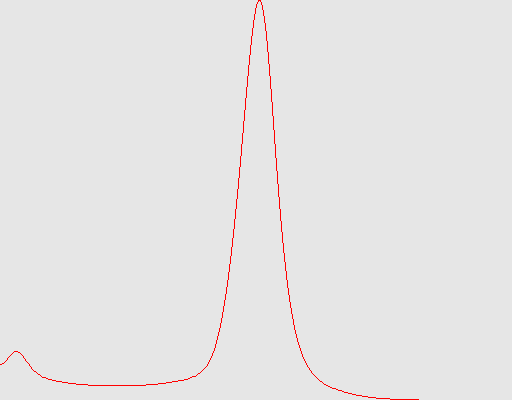
只有V通道好理解一点,V通道直方图平滑的效果图(平滑前和平滑后)
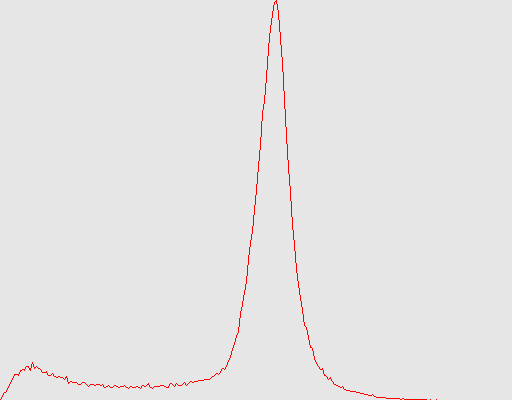
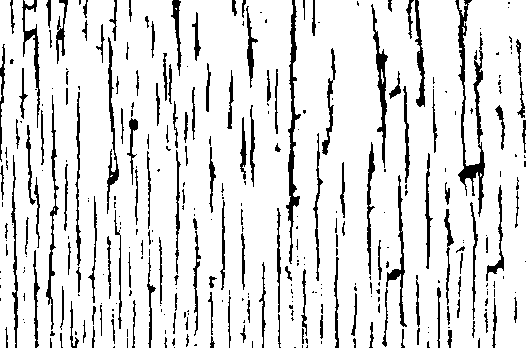
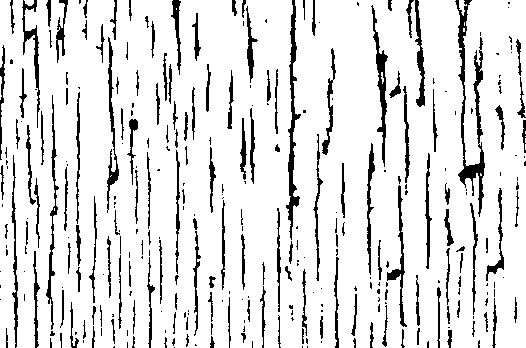
得到阈值minTh=66; 二值化后的结果图:

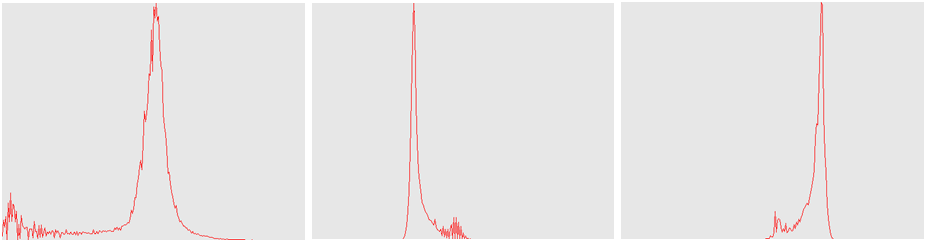
2. 如果不转换颜色空间,直接灰度化的效果怎么样呢?以下分别是灰度直方图,平滑后的直方图和二值化效果图。
3. 如果换成Lab颜色空间呢?
发现L通道双峰特点相对明显,a通道(或b通道)前景和背景的灰度值差别变小,可能是需要将(a,b)通道合起来才能说明颜色,单独通道意义不大。
L通道直方图minTh=59,平滑后的效果图和二值化效果图:
总结:
1.针对这张测试图像,直方图双峰法的效果还不错。
2.颜色空间转换对这张测试图影响不大。


 1244
1244


 被折叠的 条评论
为什么被折叠?
被折叠的 条评论
为什么被折叠?
 到【灌水乐园】发言


