


QwtPlot是用来绘制二维图像的widget。在它的画板上可以无限制的显示绘画组件。绘画组件可以是曲线(QwtPlotCurve)、标记(QwtPlotMarker)、网格(QwtPlotGrid)、或者其它从QwtPlotItem继承的组件。
QwtPlot拥有4个axes(轴线)
| yLeft | Y axis left of the canvas. |
| yRight | Y axis right of the canvas. |
| xBottom | X axis below the canvas. |
| xTop | X axis above the canvas. |
常用函数接口
| setAxisTitle | 设置轴标题 |
| enableAxis | 主要是显示xTop,yRight坐标轴 |
| setAxisMaxMajor | 设置某个某个坐标轴扩大比例尺的最大间隔数目 |
| setAxisMaxMinor | 设置某个某个坐标轴缩小比例尺的最大间隔数目 |
| setAxisScale | 禁用自动缩放比例尺,为某个坐标轴指定一个修改的比例尺 |
| insertLegend | 添加图例(标注) |
常用组件
| QwtPlotCurve | 曲线 |
| QwtPlotMarker | 标记 |
| QwtPlotGrid | 网格 |
| QwtPlotHistogram | 直方图 |
| other | 从QwtPlotItem继承的组件 |
| QwtPlotItem | plot能显示的类,如果想要实现自己绘画图形,要继承此类实现rtti和draw接口 |
| QwtPlotPanner | 平移器 (用鼠标左键平移) |
| QwtPlotMagnifier | 放大器 (用鼠标滚轮缩放) |
| QwtPlotCanvas | 画布 |
| QwtScaleMap | 比例图---可以提供一个逻辑区域到实际区域的坐标转换 |
| QwtScaleWidget | 比例窗口 |
| QwtScaleDiv | 比例布局 |
| QwtLegent | 标注 |
| QwtPlotLayout | 布局管理器 |
| QwtScaleDraw | 自画坐标轴 |
QwtPlotCure简介
常见接口
| setPen | 设置画笔 |
| setData | 设置曲线的数据 |
| setStyle | 设置曲线形式,点、直线、虚线等等 |
| setCurveAttribute | 设置曲线属性,一般设置Fitted |
| attch | 把曲线附加到QwlPlot上 |
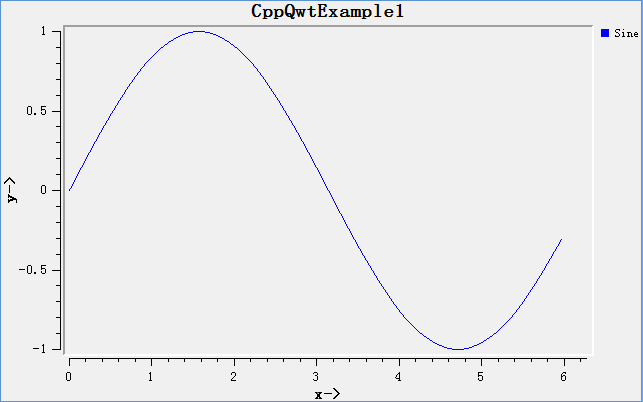
下面看一个小例子,结果如下:
源代码:
- #include <QtGui/QApplication>
- #include <Qt/qmath.h>
- #include <QVector>
- #include <qwt_plot.h>
- #include <qwt_plot_curve.h>
- #include <qwt_plot_magnifier.h>
- #include <qwt_plot_panner.h>
- #include <qwt_legend.h>
- int main(int argc, char *argv[])
- {
- QApplication a(argc, argv);
- QwtPlot plot(QwtText("CppQwtExample1"));
- plot.resize(640,400);
- //设置坐标轴的名称
- plot.setAxisTitle(QwtPlot::xBottom, "x->");
- plot.setAxisTitle(QwtPlot::yLeft, "y->");
- //设置坐标轴的范围
- plot.setAxisScale(QwtPlot::xBottom, 0.0, 2.0 * M_PI);
- plot.setAxisScale(QwtPlot::yLeft, -1.0, 1.0);
- //设置右边标注
- plot.insertLegend(new QwtLegend(), QwtPlot::RightLegend);
- //使用滚轮放大/缩小
- (void) new QwtPlotMagnifier( plot.canvas() );
- //使用鼠标左键平移
- (void) new QwtPlotPanner( plot.canvas() );
- //计算曲线数据
- QVector<double> xs;
- QVector<double> ys;
- for (double x = 0; x < 2.0 * M_PI; x+=(M_PI / 10.0))
- {
- xs.append(x);
- ys.append(qSin(x));
- }
- //构造曲线数据
- QwtPointArrayData * const data = new QwtPointArrayData(xs, ys);
- QwtPlotCurve curve("Sine");
- curve.setData(data);//设置数据
- curve.setStyle(QwtPlotCurve::Lines);//直线形式
- curve.setCurveAttribute(QwtPlotCurve::Fitted, true);//是曲线更光滑
- curve.setPen(QPen(Qt::blue));//设置画笔
- curve.attach(&plot);//把曲线附加到plot上
- plot.show();
- return a.exec();
- }
转自http://blog.csdn.net/zhx6044/article/details/9114733
学习这个东西方向对了,就对了一半
今天我开始学习基于qt库的一个开源的绘制2维的统计图的库--qwt。
我们画东西首先要有一个容器,不然都是徒劳,今天我们就介绍这个类--QwtPlot
它继承自QFrame和QwtPlotDict,QFrame提供一个QWidget的框架,QwtPlotDict为QwtPlot管理在其中的plot items,就是绘制的项。在QwtPlot上我们可以绘制无限多个的plot items,这些plot items可以是曲线,标记,格子以及继承自QwtPlotItem的子类。一个QwtPlot可以有四个轴,每个plot item连接到x和y轴上。在轴上的比例变换可以使用QwtScaleDiv,对于plot items比例可以使用QwtScaleEngine来计算,在每个轴上,QwtScaleEngine可以被单独设置。
在QwtPlot中有两个枚举类型。
Axis,轴,5个值,一个QwtPlot除了x和y,还有top和bottom轴,第五个是axisCnt,轴数,枚举从0开始,第五个为4,说明一共四个轴。另一个是LegendPosition,图例的位置。
它有五个值,分别指定插入一个图例仔什么位置,四个都是和x和y轴的位置有关,最后一个是特殊的,它允许不在这个Plot中,就是外部的。
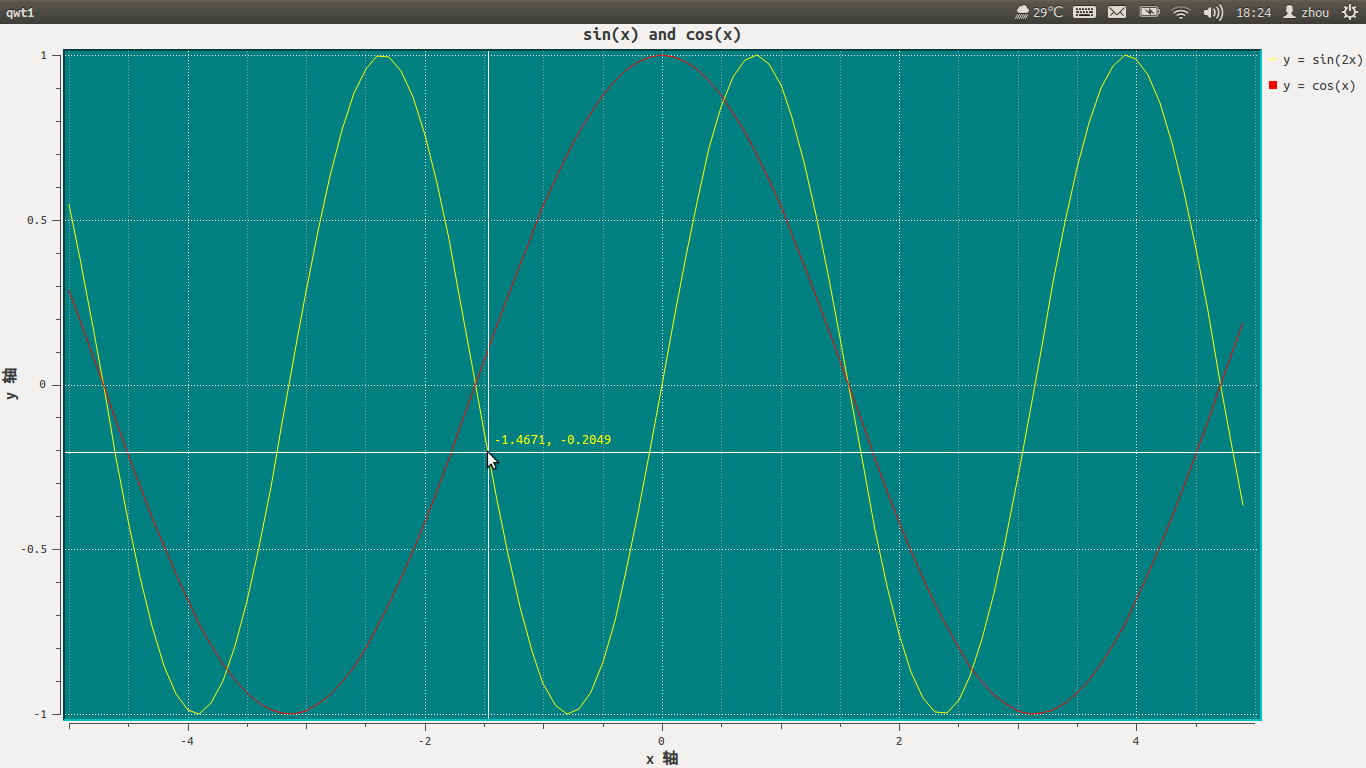
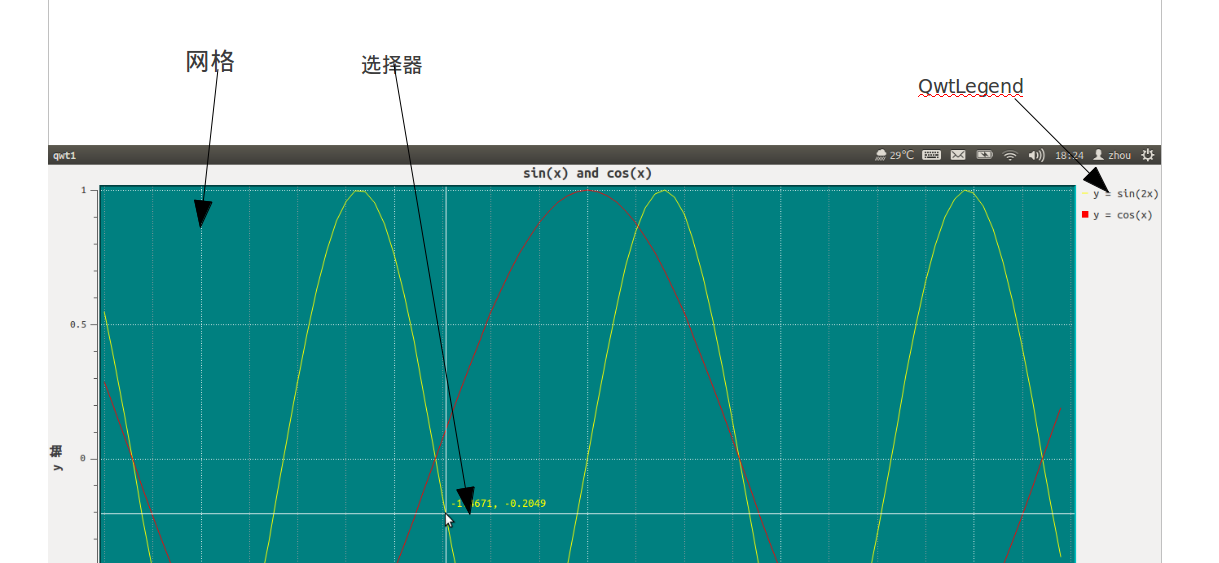
这是今天写的一个小例子


 3720
3720


 被折叠的 条评论
为什么被折叠?
被折叠的 条评论
为什么被折叠?
 到【灌水乐园】发言


