


# -*- coding: utf-8 -*-
import matplotlib.pyplot as plt
import numpy as np
# 确定坐标轴
plt.xlim((-3, 3))
plt.ylim((-70, 150))
# 确定函数的x,y点
# 原函数
x1 = np.linspace(-3,3.5,100)
def y1(x1):
y1 = 3*x1**3 + 2*x1**2 + x1 + 4
return y1
# 一阶导数
x2 = x1
def y2(x2):
y2 = 9*x2**2 + 4*x2 + x2
return y2
# 二阶导数
x3 = x1
def y3(x3):
y3 = 18*x3 + 4
return y3
# plot为绘制图像的函数,label为标记
plt.plot(x1, y1(x1), 'r-',linewidth=1,label='f(x)')
plt.plot(x2, y2(x2), 'g--',linewidth=1,label="f '(x)")
plt.plot(x3, y3(x3), 'b-',linewidth=0.8,label="f ' '(x)")
# 在图上添加文字注释
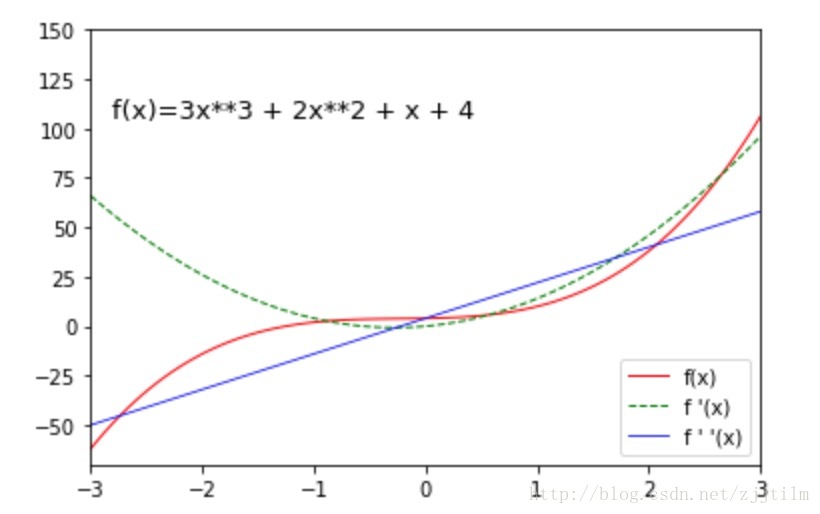
plt.text(-2.8,y1(3),'f(x)=3x**3 + 2x**2 + x + 4',size=13)
# 将标记绘制图例
plt.legend(['f(x)',"f '(x)","f ' '(x)"], loc = 'lower right')
plt.show() 运行效果如下:


 7243
7243


 被折叠的 条评论
为什么被折叠?
被折叠的 条评论
为什么被折叠?
 到【灌水乐园】发言


