


引言
我们还可以对图形中的坐标轴进行处理,包括x、y轴对换、设定坐标轴范围、刻度线修改与去除等等。要想对图形玩得转,坐标轴处理精通不可或缺。
坐标轴对换
我们使用coord_flip()函数来对换坐标轴。
library(ggplot2)
library(gcookbook)
ggplot(PlantGrowth, aes(x=group, y=weight)) + geom_boxplot()
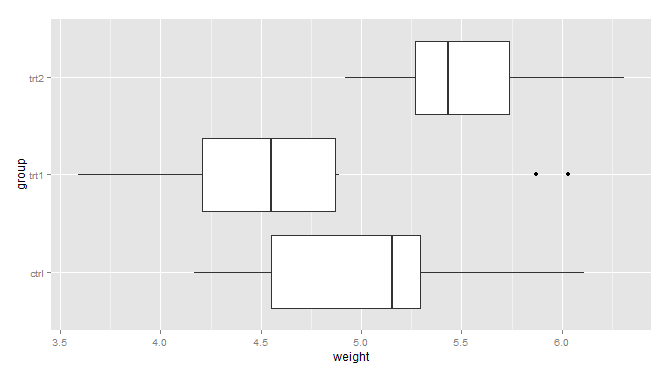
ggplot(PlantGrowth, aes(x=group, y=weight)) + geom_boxplot() + coord_flip()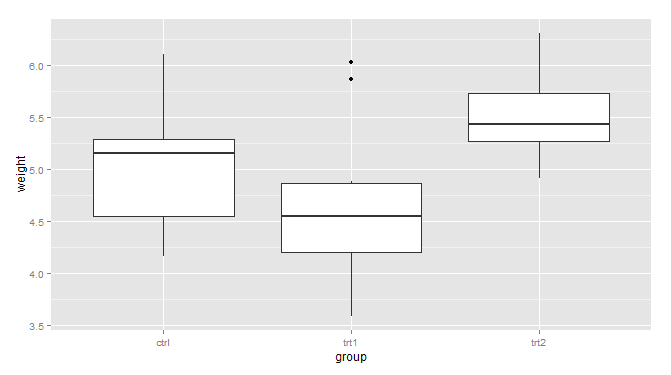
置换x、y轴时有时候会导致某一坐标轴的坐标被逆转。比如说原x轴的数据是从左往右阅读的,在对换后,原来数据会从下往上给呈现。有时这是个问题。如果x是因子,我们可以对其用带参数limits=rev(levels(…))的函数scale_x_discrete()进行修正。
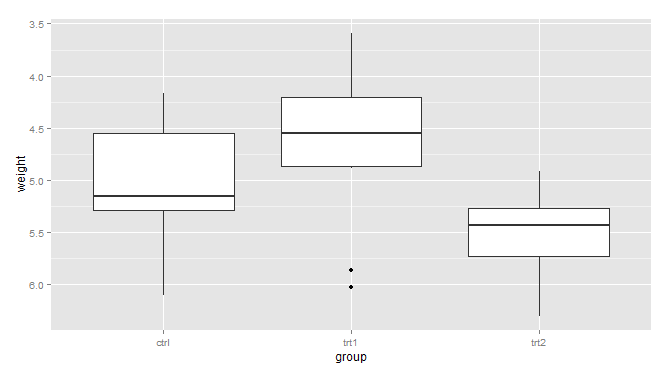
如果是连续变量,我们可以使用函数scale_y_reverse 或者scale_x_reverse来逆转坐标轴。
如果我们想改变分类变量的显示顺序,可以设置scale_x_discrete() or scale_y_discrete()函数就行。
#因子坐标轴
ggplot(PlantGrowth, aes(x=group, y=weight)) + geom_boxplot() + coord_flip() +
scale_x_discrete(limits=rev(levels(PlantGrowth$group)))
#连续变量的逆转
ggplot(PlantGrowth, aes(x=group, y=weight)) + geom_boxplot() + scale_y_reverse()
#改变分类变量顺序
ggplot(PlantGrowth, aes(x=group, y=weight)) + geom_boxplot()+scale_x_discrete(limits=c("trt1","ctrl","trt2"))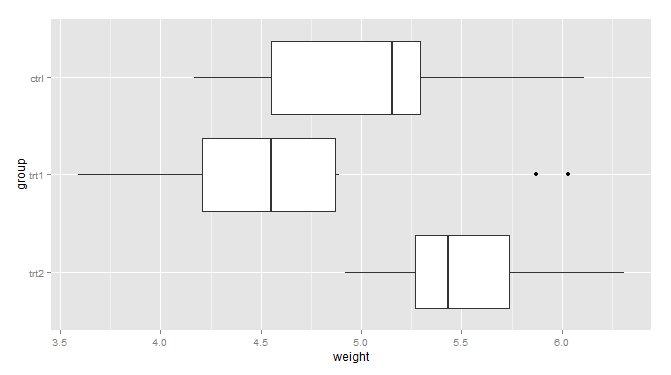
 最低0.47元/天 解锁文章


 1819
1819


 被折叠的 条评论
为什么被折叠?
被折叠的 条评论
为什么被折叠?
 到【灌水乐园】发言


