


import numpy as np
import matplotlib.pyplot as plt
plt.rcParams['font.sans-serif']='SimHei'
plt.rcParams['axes.unicode_minus']=False
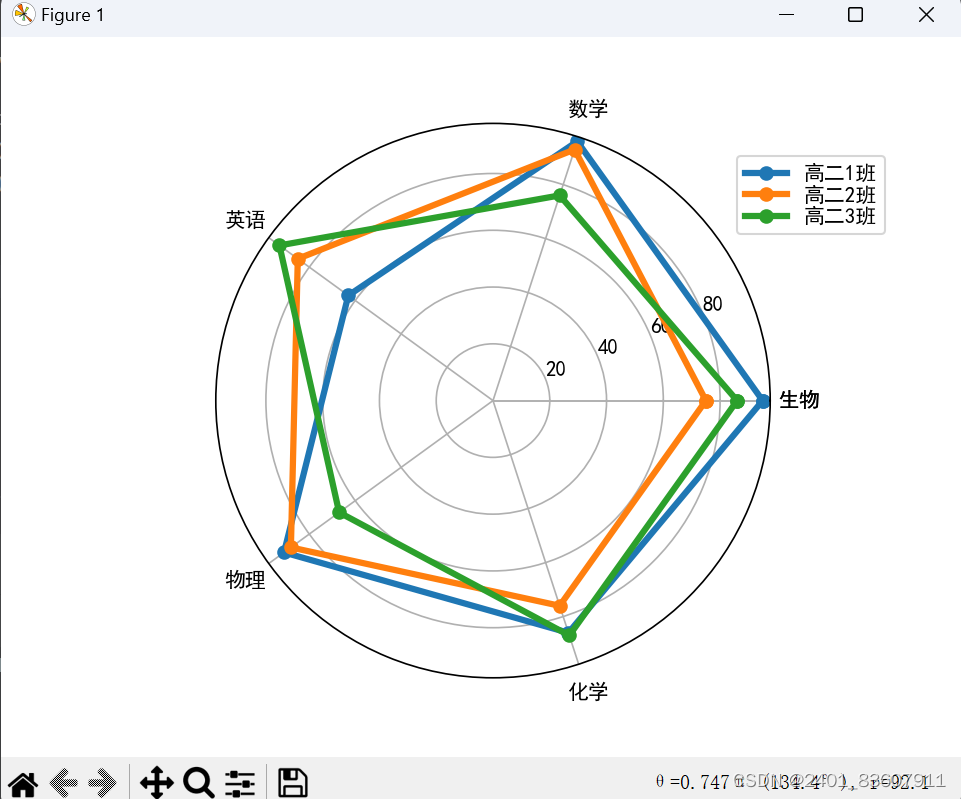
def function1():
courses = np.array(['语文', '数学', '英语', '物理', '化学', '生物'])
scores = np.array([[95, 75, 86],
[96, 93, 76],
[63, 85, 93],
[91, 88, 67],
[86, 76, 87]])
data_length = len(scores)
angles = np.linspace(0, 2 * np.pi, data_length, endpoint=False)
scores = np.concatenate((scores, [scores[0]]))
angles = np.concatenate((angles, [angles[0]]))
plt.polar(angles, scores, 'o-', linewidth=3)
plt.thetagrids(angles * 180 / np.pi, courses, fontproperties='simhei')
plt.legend(['高二1班', '高二2班', '高二3班'], loc=(0.94, 0.80), labelspacing=0.1)
plt.show()
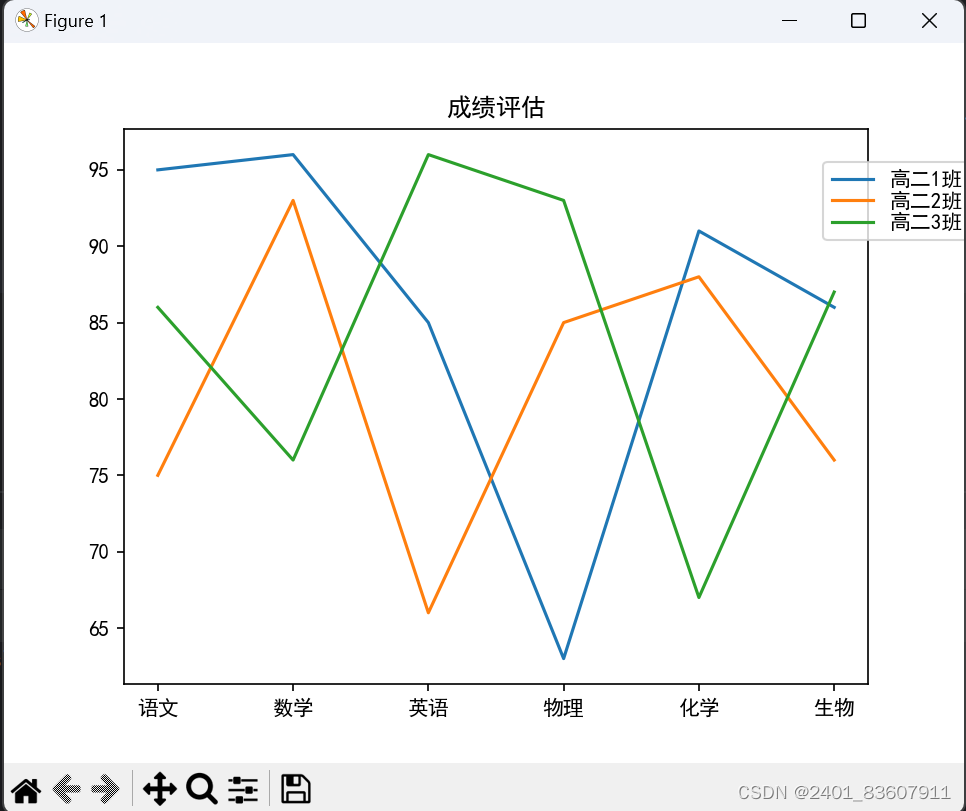
def function2():
courses = np.array(['语文', '数学', '英语', '物理', '化学', '生物'])
scores1 = np.array([95, 96, 85, 63, 91, 86])
scores2 = np.array([75, 93, 66, 85, 88, 76])
scores3 = np.array([86, 76, 96, 93, 67, 87])
# k=np.linspace(1,6,6)
# plt.thetagrids(k,courses,fontproperties='simhei')
x = [1, 2, 3, 4, 5, 6]
plt.xticks(x, courses)
plt.plot(x, scores1)
plt.plot(x, scores2)
plt.plot(x, scores3)
plt.legend(['高二1班', '高二2班', '高二3班'], loc=(0.94, 0.80), labelspacing=0.1)
plt.title("成绩评估")
plt.show()
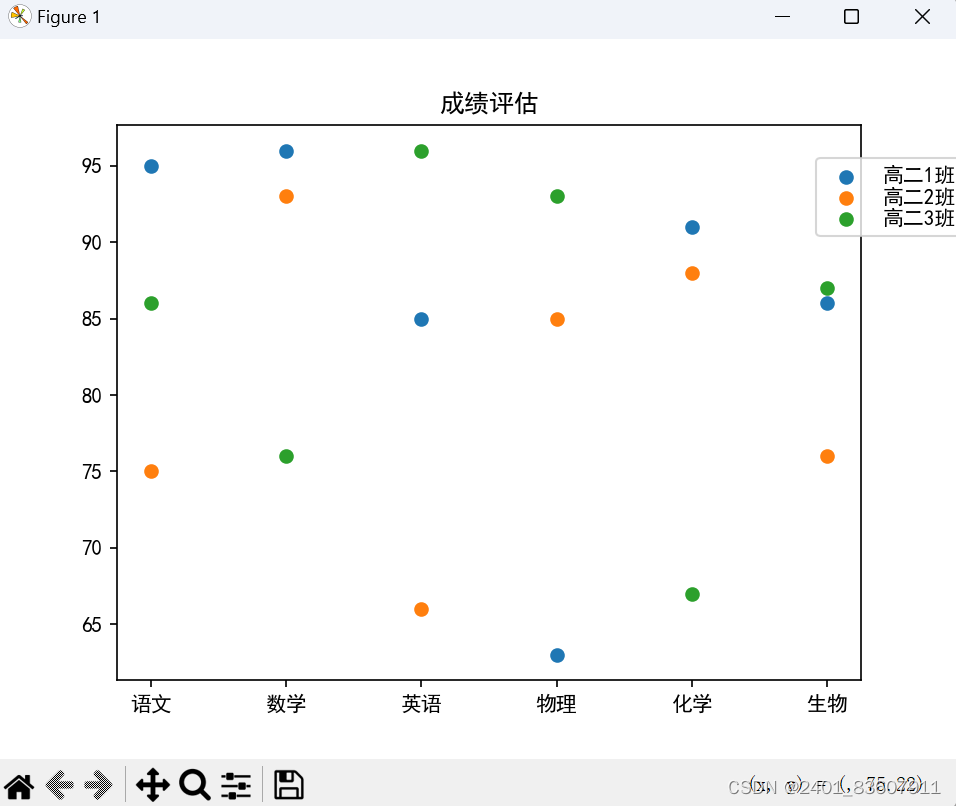
def function3():
courses = np.array(['语文', '数学', '英语', '物理', '化学', '生物'])
scores1 = np.array([95, 96, 85, 63, 91, 86])
scores2 = np.array([75, 93, 66, 85, 88, 76])
scores3 = np.array([86, 76, 96, 93, 67, 87])
# k=np.linspace(1,6,6)
# plt.thetagrids(k,courses,fontproperties='simhei')
x = [1, 2, 3, 4, 5, 6]
plt.xticks(x, courses)
plt.scatter(x, scores1)
plt.scatter(x, scores2)
plt.scatter(x, scores3)
plt.legend(['高二1班', '高二2班', '高二3班'], loc=(0.94, 0.80), labelspacing=0.1)
plt.title("成绩评估")
plt.show()
def function4():
courses = np.array(['语文', '数学', '英语', '物理', '化学', '生物'])
scores1 = np.array([95, 96, 85, 63, 91, 86])
scores2 = np.array([75, 93, 66, 85, 88, 76])
scores3 = np.array([86, 76, 96, 93, 67, 87])
x = np.linspace(0, 6, 6)
plt.xticks(x, courses)
width = 0.15
plt.bar(x - width, scores1, width=0.15)
plt.bar(x, scores2, width=0.15)
plt.bar(x + width, scores3, width=0.15)
plt.legend(['高二1班', '高二2班', '高二3班'], loc=(0.94, 0.80), labelspacing=0.1)
plt.title("成绩评估")
plt.show()
function1()
function2()
function3()
function4()


 被折叠的 条评论
为什么被折叠?
被折叠的 条评论
为什么被折叠?
 到【灌水乐园】发言


