


[root@VM_2-45 /usr/local/prometheus]# ./prometheus --help
2.1 prometheus.yml 配置解释
# my global config
global:
  # 默认情况下,每15s拉取一次目标采样点数据。
  scrape_interval:     15s # Set the scrape interval to every 15 seconds. Default is every 1 minute.
  # 每15秒评估一次规则。默认值为每1分钟。
  evaluation_interval: 15s # Evaluate rules every 15 seconds. The default is every 1 minute.
  # scrape_timeout is set to the global default (10s).

# Alertmanager configuration
alerting:
  alertmanagers:
  - static_configs:
    - targets:
      # - alertmanager:9093

# Load rules once and periodically evaluate them according to the global 'evaluation_interval'.
rule_files:
  # - "first_rules.yml"
  # - "second_rules.yml"

# A scrape configuration containing exactly one endpoint to scrape:
# Here it's Prometheus itself.
scrape_configs:
  # job名称会增加到拉取到的所有采样点上,同时还有一个instance目标服务的host:port标签也会增加到采样点上
  - job_name: 'prometheus'

    # 覆盖global的采样点,拉取时间间隔5s
    scrape_interval: 5s
    static_configs:
    - targets: ['localhost:9090']
2.2 启动服务
# 启动服务
[root@VM_2-45 /usr/local/prometheus]# ./prometheus --config.file=prometheus.yml


# 指定配置文件
--config.file="prometheus.yml"
# 默认指定监听地址端口,可修改端口
--web.listen-address="0.0.0.0:9090"
# 最大连接数
--web.max-connections=512
# tsdb数据存储的目录,默认当前data/
--storage.tsdb.path="data/"
# premetheus 存储数据的时间,默认保存15天
--storage.tsdb.retention=15d
# 通过命令热加载无需重启 curl -XPOST 192.168.2.45:9090/-/reload
--web.enable-lifecycle
# 可以启用 TLS 或 身份验证 的配置文件的路径
--web.config.file=""


启动选项了解:./prometheus --help
2.3 访问:http://localhost:9090
![[外链图片转存失败,源站可能有防盗链机制,建议将图片保存下来直接上传(img-GlBdVFxb-1615534500769)(08736E415D4E482D94C292A069393B6C)]](https://img-blog.csdnimg.cn/2021031215355036.png?x-oss-process=image/watermark,type_ZmFuZ3poZW5naGVpdGk,shadow_10,text_aHR0cHM6Ly9ibG9nLmNzZG4ubmV0L3FxXzMxNzI1Mzcx,size_16,color_FFFFFF,t_70)
2.4 查看暴露指标
http://localhost:9090/metrics
2.5 将Prometheus配置为系统服务
- 1.进入systemd目录下:cd /usr/lib/systemd/system
[root@VM_2-45 ~]# cd /usr/lib/systemd/system
- 2.创建文件:vim prometheus.service
[Unit]
  Description=https://prometheus.io

  [Service]
  Restart=on-failure
  ExecStart=/usr/local/prometheus/prometheus --config.file=/usr/local/prometheus/prometheus.yml --web.listen-address=:9090

  [Install]
  WantedBy=multi-user.target
- 3.生效系统system文件
systemctl daemon-reload
- 4.启动服务
[root@VM_2-45 ~]# systemctl start prometheus
3. 客户端,配置服务发现监控linux主机及相关服务
| IP | 角色 | 系统 |
|---|---|---|
| 192.168.2.45 | Prometheus 服务端 | CentOS 7 |
| 192.168.2.44 | node_exporter 客户端 | CentOS 7 |
3.1 客户端安装node_exporter
3.1.1 监控Linux 安装常用node_exporter
[root@VM_2-44 ~]# wget https://github.com/prometheus/node_exporter/releases/download/v1.1.2/node_exporter-1.1.2.linux-amd64.tar.gz
[root@VM_2-44 ~]# tar xf node_exporter-1.1.2.linux-amd64.tar.gz -C /usr/local/
[root@VM_2-44 ~]# mv node_exporter-1.1.2.linux-amd64/ node_exporter
3.1.2 启动node_exporter,并添加到服务
# 直接启动
[root@VM_2-44 /usr/local/node_exporter]# ./node_exporter &

# 启动后会监听9100端口


# 添加为服务方式启动
[root@VM_2-44 ~]# vim /usr/lib/systemd/system/node_exporter.service
[Unit]
Description=node_exporter
After=network.target

[Service]
ExecStart=/usr/local/node_exporter/node_exporter
Restart=on-failure

[Install]
WantedBy=multi-user.target

# 启动node_exporter
systemctl daemon-reload
systemctl start node_exporter
3.1.3 普罗米修斯服务端配置文件添加监控项
[root@VM_2-45 /usr/local/prometheus]# cat prometheus.yml
# my global config
global:
  scrape_interval:     15s # Set the scrape interval to every 15 seconds. Default is every 1 minute.
  evaluation_interval: 15s # Evaluate rules every 15 seconds. The default is every 1 minute.
  # scrape_timeout is set to the global default (10s).

# Alertmanager configuration
alerting:
  alertmanagers:
  - static_configs:
    - targets:
      # - alertmanager:9093

# Load rules once and periodically evaluate them according to the global 'evaluation_interval'.
rule_files:
scrape_configs:
  - job_name: 'prometheus'
    static_configs:
    - targets: ['192.168.2.45:9090']

  - job_name: 'linux'
    static_configs:
    - targets: ['192.168.2.44:9100','192.168.2.43:9100'] # 多个用,分开

# 添加上面三行
3.1.4 重启普罗米修斯
[root@VM_2-45 /usr/local/prometheus]# systemctl restart prometheus.service
- 打开普罗米修斯自带的监控页面,Status -> Targets 查看:
![[外链图片转存失败,源站可能有防盗链机制,建议将图片保存下来直接上传(img-vbIfPE38-1615534500770)(63E10467ED8E43969ED111B99F43D01C)]](https://img-blog.csdnimg.cn/20210312153616257.png?x-oss-process=image/watermark,type_ZmFuZ3poZW5naGVpdGk,shadow_10,text_aHR0cHM6Ly9ibG9nLmNzZG4ubmV0L3FxXzMxNzI1Mzcx,size_16,color_FFFFFF,t_70)
3.2 监控mysql(mysqld-exporter)
Grafana使用这个模板链接: https://pan.baidu.com/s/1sVE5_oEUnak4vTU7XaT5ig 提取码: k5gi
[root@VM_2-44 ~]# wget https://github.com/prometheus/mysqld_exporter/releases/download/v0.12.1/mysqld_exporter-0.12.1.linux-amd64.tar.gz
[root@VM_2-44 ~]# tar xf mysqld_exporter-0.12.1.linux-amd64.tar.gz -C /usr/local/
[root@VM_2-44 /usr/local]# mv mysqld_exporter-0.12.1.linux-amd64 mysqld_exporter
[root@VM_2-44 /usr/local/mysqld_exporter]# vim .my.cnf
[client]
user=root
password=123456
3.2.1 启动mysqld-exporter
[root@VM_2-44 /usr/local/mysqld_exporter]# ./mysqld_exporter --config.my-cnf="/usr/local/mysqld_exporter/.my.cnf" &
[root@VM_2-44 /usr/local/mysqld_exporter]# ps -ef |grep exporter
root       3447   3398  0 01:31 pts/1    00:00:02 ./node_exporter
root       4647   3398  0 02:13 pts/1    00:00:00 ./mysqld_exporter --config.my-cnf=/usr/local/mysqld_exporter/.my.cnf
root       4654   3398  0 02:13 pts/1    00:00:00 grep --color=auto exporter
[root@VM_2-44 /usr/local/mysqld_exporter]# ss -lntp |grep 4647
LISTEN     0      128         :::9104                    :::*                   users:(("mysqld_exporter",pid=4647,fd=3))
[root@VM_2-44 /usr/local/mysqld_exporter]#

# 启动后会监听9104端口
3.2.2 普罗米修斯配置文件添加监控项后重启
[root@VM_2-45 /usr/local/prometheus]# vim prometheus.yml
  - job_name: 'mysql'
    static_configs:
    - targets: ['192.168.2.44:9104']
![[外链图片转存失败,源站可能有防盗链机制,建议将图片保存下来直接上传(img-Ra0ZWYMI-1615534500772)(3FED6FBB52F24F15B459AD06CC9FEED9)]](https://img-blog.csdnimg.cn/20210312153719624.png?x-oss-process=image/watermark,type_ZmFuZ3poZW5naGVpdGk,shadow_10,text_aHR0cHM6Ly9ibG9nLmNzZG4ubmV0L3FxXzMxNzI1Mzcx,size_16,color_FFFFFF,t_70)
- 重启普罗米修斯
[root@VM_2-45 /usr/local/prometheus]# systemctl restart prometheus.service
![[外链图片转存失败,源站可能有防盗链机制,建议将图片保存下来直接上传(img-BN2kDYHD-1615534500774)(B556B74646E449CEBCF8E606AA3CA228)]](https://img-blog.csdnimg.cn/20210312153729848.png?x-oss-process=image/watermark,type_ZmFuZ3poZW5naGVpdGk,shadow_10,text_aHR0cHM6Ly9ibG9nLmNzZG4ubmV0L3FxXzMxNzI1Mzcx,size_16,color_FFFFFF,t_70)
3.1.1 为了管理服务,将宿主机节点监控采集node_exporter加入到服务配置文件里
[root@VM_2-44 ~]# vi /usr/lib/systemd/system/node_exporter.service

[Unit]
Description=https://prometheus.io

[Service]
Restart=on-failure
ExecStart=/usr/local/node_exporter/node_exporter --collector.systemd --collector.systemd.unit-whitelist=(docker|sshd|nginx).service

[Install]
WantedBy=multi-user.target


# 监控客户端,docker服务,nginx服务,sshd
如果要监控节点的系统服务,需要在后面添加名单参数
–collector.systemd.unit-whitelist=“.+” 从systemd中循环正则匹配单元
–collector.systemd.unit-whitelist=“(docker|sshd|nginx).service” 白名单,收集目标
/usr/bin/node_exporter --collector.systemd --collector.systemd.unit-whitelist=(docker|sshd|nginx).service
4. Grafana 展示 Prometheus 数据
wget https://mirrors.tuna.tsinghua.edu.cn/grafana/yum/rpm/grafana-7.4.3-1.x86_64.rpm
[root@VM_2-45 ~]# yum install initscripts fontconfig
[root@VM_2-45 ~]# yum install -y grafana-7.4.3-1.x86_64.rpm
[root@VM_2-45 ~]# systemctl status grafana-server.service
启动后访问地址:ip:3000
初始用户名和密码都是admin
4.1 添加Prometheus数据源
Configuration -> Data Sources ->add data source -> Prometheus
![[外链图片转存失败,源站可能有防盗链机制,建议将图片保存下来直接上传(img-4iVhER8e-1615534500775)(68B71080ABF54BE28FE84801894EE4DD)]](https://img-blog.csdnimg.cn/20210312153801286.png?x-oss-process=image/watermark,type_ZmFuZ3poZW5naGVpdGk,shadow_10,text_aHR0cHM6Ly9ibG9nLmNzZG4ubmV0L3FxXzMxNzI1Mzcx,size_16,color_FFFFFF,t_70)
4.2 新增Dashboard Linux基础数据展示
Create -> import
![[外链图片转存失败,源站可能有防盗链机制,建议将图片保存下来直接上传(img-kh7Ifjdz-1615534500775)(1BA665086C004F7EAE21564B513E6542)]](https://img-blog.csdnimg.cn/20210312153815598.png?x-oss-process=image/watermark,type_ZmFuZ3poZW5naGVpdGk,shadow_10,text_aHR0cHM6Ly9ibG9nLmNzZG4ubmV0L3FxXzMxNzI1Mzcx,size_16,color_FFFFFF,t_70)
4.2.2 导入模板8919
已经画好的模板链接: https://pan.baidu.com/s/1d70reg4Mro3Dh17bb-ZEVA 提取码: b6c1
更多grafana模板: https://grafana.com/grafana/dashboards 搜索 相应 dashboards的id如8919,12227
![[外链图片转存失败,源站可能有防盗链机制,建议将图片保存下来直接上传(img-RGCoQNaY-1615534500776)(F9E3AD6175614D828E27EEC6CCE806C5)]](https://img-blog.csdnimg.cn/20210312153854246.png?x-oss-process=image/watermark,type_ZmFuZ3poZW5naGVpdGk,shadow_10,text_aHR0cHM6Ly9ibG9nLmNzZG4ubmV0L3FxXzMxNzI1Mzcx,size_16,color_FFFFFF,t_70)
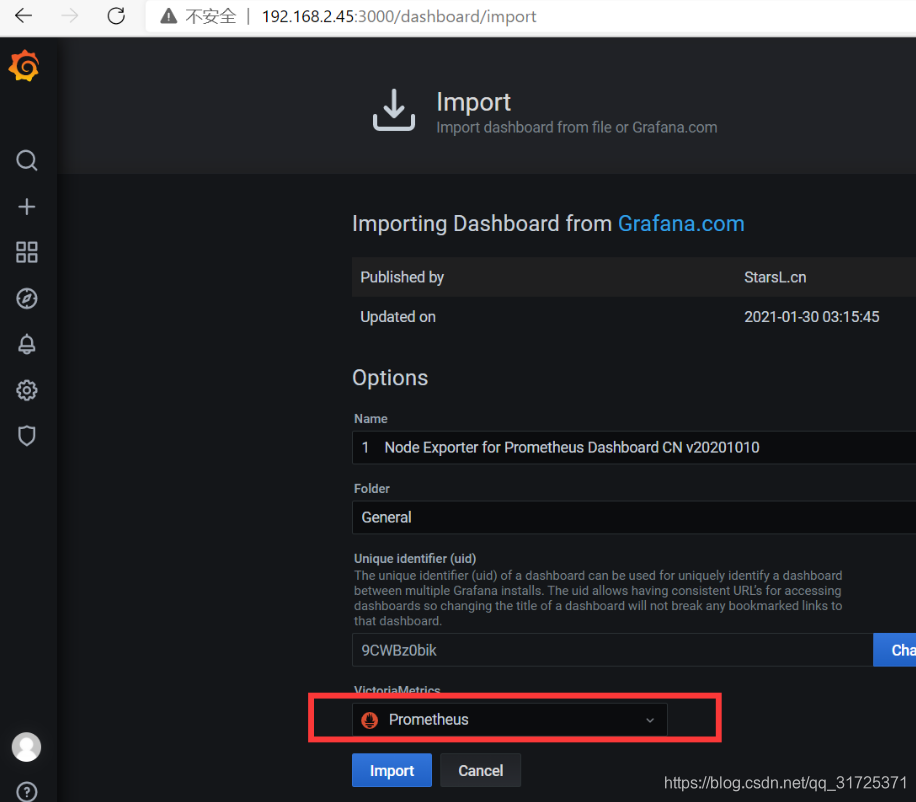
4.2.3 选择数据源
4.2.4 查看Dashboard
Dashboards ->Manage
![[外链图片转存失败,源站可能有防盗链机制,建议将图片保存下来直接上传(img-oqhoPWbO-1615534500777)(8F21001E0D2947EC94582639BEDF62E5)]](https://img-blog.csdnimg.cn/20210312154020245.png?x-oss-process=image/watermark,type_ZmFuZ3poZW5naGVpdGk,shadow_10,text_aHR0cHM6Ly9ibG9nLmNzZG4ubmV0L3FxXzMxNzI1Mzcx,size_16,color_FFFFFF,t_70)
4.3 新增Dashboard MySQL数据展示
- 上面3.2的内容完成后,在继续下面操作
4.3.1 设置数据源
![[外链图片转存失败,源站可能有防盗链机制,建议将图片保存下来直接上传(img-L3PWkOmo-1615534500778)(2FFDE2D5B020497C93627B9F8D3B220B)]](https://img-blog.csdnimg.cn/20210312154034223.png?x-oss-process=image/watermark,type_ZmFuZ3poZW5naGVpdGk,shadow_10,text_aHR0cHM6Ly9ibG9nLmNzZG4ubmV0L3FxXzMxNzI1Mzcx,size_16,color_FFFFFF,t_70)
- 数据库上授权远程账户
![[外链图片转存失败,源站可能有防盗链机制,建议将图片保存下来直接上传(img-clGbSZqm-1615534500778)(94B07BA1545D43DA955EC3E467B9DB27)]](https://img-blog.csdnimg.cn/20210312154049382.png?x-oss-process=image/watermark,type_ZmFuZ3poZW5naGVpdGk,shadow_10,text_aHR0cHM6Ly9ibG9nLmNzZG4ubmV0L3FxXzMxNzI1Mzcx,size_16,color_FFFFFF,t_70)
4.3.2 导入已经画好的dashboard,数据源选择刚刚创建好的mysql数据源即可
链接:https://pan.baidu.com/s/12S33kZkZd9gIXF8tMHKECg 提取码9b0s
或者链接:https://pan.baidu.com/s/1GBzogDLsYS3IvwH4WbdPLw 提取码:ef6e
将下载的json打开复制进去加载
![[外链图片转存失败,源站可能有防盗链机制,建议将图片保存下来直接上传(img-GVErpmvl-1615534500779)(AC3BB3A19ABB43E2A8C53BE2FEA59239)]](https://img-blog.csdnimg.cn/20210312154106589.png?x-oss-process=image/watermark,type_ZmFuZ3poZW5naGVpdGk,shadow_10,text_aHR0cHM6Ly9ibG9nLmNzZG4ubmV0L3FxXzMxNzI1Mzcx,size_16,color_FFFFFF,t_70)
5. 监控Redis(redis_exporter)
链接:https://pan.baidu.com/s/12y7HxtQlBjFwr_i8ClM8Kw 提取码:13v2
5.1 安装redis_exporter
或者下载:
wget https://github.com/oliver006/redis_exporter/releases/download/v0.15.0/redis_exporter-v0.15.0.linux-amd64.tar.gz
tar -C /usr/local/ -xvf redis_exporter-v0.15.0.linux-amd64.tar.gz
5.2启动redis_exporter
默认redis_exporter端口为9121
./redis_exporter redis//192.168.0.103:6379 & -web.listenaddress 192.168.0.103:9121
5.3 prometheus配置文件中加入redis监控并重启
vim /usr/local/Prometheus/prometheus.yml

# 默认redis-exporter端口为9121
- job_name: 'Redis'
    static_configs:
    - targets: ['192.168.2.44:9121']
5.4 grafana导入画好的dashboard
链接:https://pan.baidu.com/s/1LIkVC0o3lyTT59JbX0mSpg 提取码:gf1d
![[外链图片转存失败,源站可能有防盗链机制,建议将图片保存下来直接上传(img-w1RRATmR-1615534500780)(BC17EC5A3FD44E9AA1B73E3730EE5A11)]](https://img-blog.csdnimg.cn/20210312154119702.png?x-oss-process=image/watermark,type_ZmFuZ3poZW5naGVpdGk,shadow_10,text_aHR0cHM6Ly9ibG9nLmNzZG4ubmV0L3FxXzMxNzI1Mzcx,size_16,color_FFFFFF,t_70)


 2156
2156

 被折叠的 条评论
为什么被折叠?
被折叠的 条评论
为什么被折叠?
 到【灌水乐园】发言


